
SLIDE 1
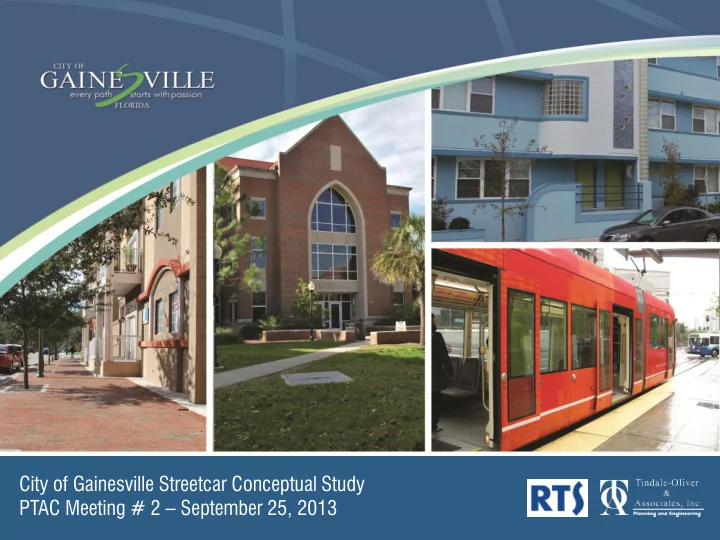
City of Gainesville Streetcar Conceptual Study PTAC Meeting # 2 – September 25, 2013
City of Gainesville Streetcar Conceptual Study PTAC Meeting # 2 - - PowerPoint PPT Presentation
City of Gainesville Streetcar Conceptual Study PTAC Meeting # 2 September 25, 2013 Project Scope/ Schedule Project Goals Project Conceptualization Identification of Corridors 2-3 Options Engineering, Parking Transportation Preliminary
City of Gainesville Streetcar Conceptual Study PTAC Meeting # 2 – September 25, 2013
Project Conceptualization Identification of Corridors Engineering, Parking Transportation Economic Assessment Ridership/Technology Capital/Operating Costs Land Use/Operational Characteristics
2-3 Options 1 Preferred Preliminary Screen
Corridor
2011 431,425 2010 501,959 2009 505,703 2008 484,711 2007 562,320
Ridership:
systems in Florida (2003)
local transit agency
to Downtown Tampa
assessment, contributions from government/ quasi-governmental agencies
Connects Activity Centers:
Centro Ybor and Channelside
Simulation (CAMLS)
More than $1 billion in private development in Streetcar’s Special Assessment District (since 2002)
Ridership (projected):
Component Streetcar Market Streetcar Ridership (Daily) Low Medium High Market 1: Trips to/from outside CBD 967 1,064 1,258 Market 2: Intra-CBD Trips 1,029 1,103 1,179 Market 3: Special Venues Events (daily equivalent) 203 240 330 TOTAL (equivalent daily riders) 2,199 2,407 2,766
federal, local government (city and county), and special assessment funding
General Medical Center)
initial 2.7-mile system (Phase 1a & 1b)
Regional Transit Authorities (SFRTA & BCT)
driving urban development
15,000 residential units (with densities up to 150 dwelling units per acre) and 5 million sq ft of commercial development
between $498,401,944 and $535,053,826
Ridership:
2012 3,712,762 2011 3,963,368 2010 3,914,722 2009 4,038,920 2008 3,550,316 2007 2,964,576
service area
Since 1997 within 2 blocks of alignment:
million sq ft of office, institutional, retail and hotel construction have been constructed
streetcar and properties located closest to the streetcar line more closely approach the zoned density potential than properties situated farther away
buildings with significantly lower parking ratios than anywhere else in the region
The current ridership estimate is 3,600 boardings per weekday.
construction – 3.9 miles
vacant land
students)
In the last two years:
apartments
Energy (400+ employees)
Increase in property near the transit line from 2% to 30%. Specifically, for each of 3,800 properties within 1,500 feet of the alignment, an average property will increase by $9,200 by 2015.
2011 136,380 2010 107,088 2009 119,758 2008 134,204 2007 154,644
Ridership:
(including the Clinton Presidential Library)
governments that it serves (Little Rock and North Little Rock)
area it serves
Within 4 blocks of alignment (2000- 2010):
investment (new construction & rehabilitations)
property value
value
values over land values
the less propensity for redevelopment
Building to Land Value Ratio (BLVR) - Scoring by Segment Segment Number Total Building Value of all Parcels Within Buffer Total Land Value of all Parcels Within Buffer BLVR Scoring
1 $0 $13,469,600 0.00 1 2 $13,924,800 $17,967,100 0.78 5 3 $20,552,500 $7,208,000 2.85 1 4 $0 $15,869,600 0.00 1 5 $20,864,200 $11,333,300 1.84 3 6 $26,420,100 $16,189,900 1.63 3 7 $0 $4,603,200 0.00 1 8 $96,544,700 $36,698,000 2.63 1 9 $9,477,700 $8,980,700 1.06 3 10 $9,249,000 $13,061,900 0.71 5 11 $42,606,800 $20,617,100 2.07 3 12 $24,912,100 $7,971,900 3.12 1 13 $19,247,600 $7,527,200 2.56 1 14 $56,026,200 $9,949,400 5.63 1 15 $45,923,100 $15,639,600 2.94 1 16 $5,633,300 $7,639,100 0.74 5
* For these segments, the buffer only captured properties within the University of Florida, which does not report building value.
volume over roadway capacity
the more congested the roadway segment
Max Volume/Capacity Ratio By Segment Segment Number Max V/C Ratio - 2007 Max V/C Ratio - 2035 Max V/C Ratio - 2022 Points
1 1.20 1.39 1.30 1 2 1.22 1.36 1.30 1 3 0.61 0.89 0.76 5 4 1.01 1.38 1.21 1 5 0.90 1.31 1.12 1 6 0.67 0.91 0.80 3 7 0.88 1.14 1.02 3 8 1.28 1.53 1.42 1 9 0.74 1.05 0.91 3 10 0.78 1.00 0.90 3 11 0.86 1.05 0.96 3 12 1.35 1.03 1.18 1 13 1.09 1.02 1.05 1 14 0.83 0.94 0.89 3 15 0.32 0.76 0.56 5 16 0.95 1.04 1.00 3
density for each segment
more supportive of transit
Population Density - Scoring by Segment Segment Population Density 2007 (acre) Population Density 2035 (acre) Population Density 2022 (acre) Points
1 15.33 15.33 15.33 3 2 26.80 26.80 26.80 5 3 25.01 25.40 25.22 5 4 16.65 16.65 16.65 3 5 24.55 24.55 24.55 5 6 25.29 25.65 25.48 5 7 13.56 13.56 13.56 1 8 13.06 18.46 15.95 3 9 17.08 17.08 17.08 3 10 28.78 29.16 28.98 5 11 12.30 14.99 13.74 1 12 3.67 3.69 3.68 1 13 1.72 1.72 1.72 1 14 5.61 5.65 5.63 1 15 2.97 3.02 3.00 1 16 1.66 1.71 1.69 1
density for each segment
more supportive of transit
Employment Density - Scoring by Segment Segment Employment Density 2007 (acre) Employment Density 2035 (acre) Employment Density 2022 (acre) Points
1 39.80 41.71 40.83 3 2 19.97 21.93 21.02 1 3 9.92 11.21 10.61 1 4 54.47 56.66 55.64 5 5 12.91 15.21 14.14 1 6 15.84 16.75 16.33 1 7 64.37 66.24 65.37 5 8 48.77 53.09 51.08 5 9 52.92 54.79 53.92 5 10 16.12 17.81 17.02 1 11 11.95 13.20 12.62 1 12 28.01 29.81 28.98 3 13 8.17 8.85 8.54 1 14 26.49 28.89 27.77 3 15 7.73 8.72 8.26 1 16 4.51 5.11 4.83 1
section for dedicated streetcar lane
appropriate ROW
segments that may minimize acquisitions
Right-Of-Way Assessment and Scoring by Segment Segment Total Segment Length (feet) Total Length with ROW > 70' % of Segment with ROW > 70 Scoring
1 1161.60 1161.60 100.00% 5 2 2059.20 1453.58 70.59% 3 3 633.60 0.00 0.00% 1 4 1320.00 1320.00 100.00% 5 5 1267.20 0.00 0.00% 1 6 1267.20 0.00 0.00% 1 7 422.40 422.40 100.00% 5 8 6072.00 3916.07 64.49% 3 9 2006.40 0.00 0.00% 1 10 686.40 0.00 0.00% 1 11 3168.00 168.08 5.31% 1 12 686.40 686.40 100.00% 5 13 1372.80 1372.80 100.00% 5 14 844.80 0.00 0.00% 1 15 1848.00 1848.00 100.00% 5 16 897.60 897.60 100.00% 5
Constructed A – SW 2nd Ave./SW 12th St. B – SW 2nd Ave./SW 10th St. C – SW 2nd Ave./SW 6th St. D – SE 4th St./SE Depot Ave. Proposed E – SW 6th St./SW 4th Ave. F – SE 4th St./SE Depot Ave. G – SW Main St./SW Depot Ave. H – SW 6th St./SW Depot Ave. I – SW 11th St./SW Depot Ave.
Segment 6 SW 10th Street 0.24 miles 46.88% parking Scoring: 1 Segment 3 SW 8th Avenue 0.12 miles 20.83% parking Scoring: 1 Segment 14 SW 2ND Avenue 0.16 miles 20.83% parking Scoring: 1 Segment 8 SW 2nd Avenue 1.15 miles 18.12% parking Scoring: 1
3 6 8
14
“Immediate Areas of Concern” “Potential Fatal Flaws”
Cumulative Points Summary by Segment Segment Total Scores by Segment Segment Total Scores by Segment Segment Total Scores by Segment Segment Total Scores by Segment
1 26 5 22 9 26 13 22 2 28 6 22 10 30 14 20 3 22 7 30 11 20 15 24 4 28 8 20 12 26 16 24
30 28 26 20 22 24
Cumulative Points Summary by Segment Segment Total Scores by Segment Segment Total Scores by Segment Segment Total Scores by Segment Segment Total Scores by Segment
1 26 5 22 9 26 13 22 2 28 6 22 10 30 14 20 3 22 7 30 11 20 15 24 4 28 8 20 12 26 16 24
Segment 1 – Main Alignment (1.73 miles) - Segment 2 – Potential Link to RTS (.21 miles) - Potential Alt. - SW 4th Ave. (1.79 miles) -
Ridership Estimates Economic Analysis Present Findings at PTAC #3 - Early November 2013