
SLIDE 1
City of Freeport Transportation & Utility Overview Current City - - PowerPoint PPT Presentation
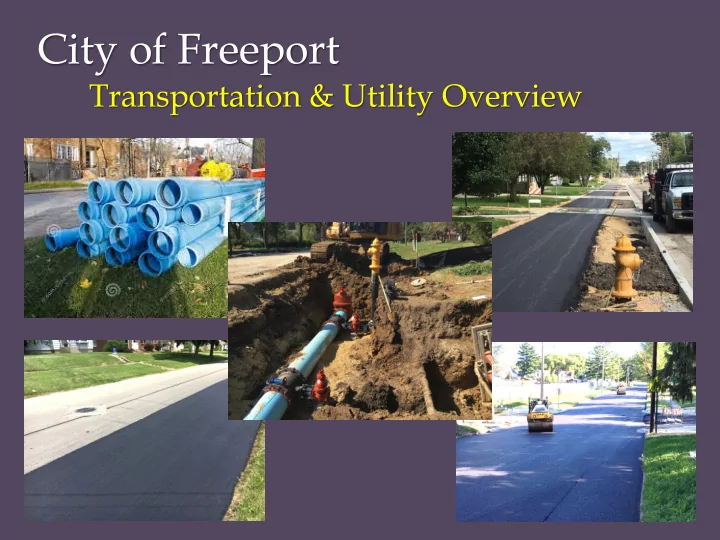
City of Freeport Transportation & Utility Overview Current City Stats Current Programs: Crack Sealing Transportation System Microsurfacing MFT 90 Local Miles & 26.5 FAU Miles Mill and Overlay STU 26.5 Miles
Current Programs:
.
Transportation System
Water Distribution
Current Programs:
Emergencies
.
Annual $538,000 Funding = 235 Year Replacement of Existing Depreciated Assets
Sewer Collection
OVER 10% OF CITY STREETS QUALIFY FOR RECONSTRUCTION 2 BRIDGES IN NEED OF REPLACEMENT
Total = $587,141.26 of which $432,485.81 came from MFT
2016 Mill & Overlay Program Engineering $0.00 Construction $443,462.44 Inspection $0.00 Testing $1,655.40 Total Cost $445,117.84 Total Length (FT) 6,934 Cost/FT $64.19 2016 Crack Sealing Program Engineering $0.00 Construction $38,532.52 Inspection $0.00 Testing $0.00 Total Cost $38,532.52 Total Length (FT) 24,959 Cost/FT $1.54
Section No. 16-00000-00-GM Covered roughly 73 Blocks or 7.2% of the City
2016 Micro-Surfacing Program Engineering $0.00 Construction $103,490.90 Inspection $0.00 Testing $0.00 Total Cost $103,490.90 Total Length (FT) 11,457 Cost/FT $9.03
MFT/City Revenue $ 72,350,000 % of Budget Reconstruct 15 Miles of Street $ 23,100,000 32.0% Replace Hancock Ave. Bridge $ 5,700,000 7.9% Replace Gladewood Bridge $ 1,600,000 2.2% Mill & Overlay 55 Miles of Street $ 23,400,000 32.3% Micro-Surface the entire City $ 6,600,000 9.1% Crack Seal the entire City $ 750,000 1.0% Patching $ 3,650,000 5.0% Contingency $ 2,150,000 3.0% Engineering $ 5,400,000 7.5% Total Cost $ 72,350,000 100%
MFT/City Revenue $ 7,235,000 % of Budget Reconstruct 1.5 Miles $ 2,310,000 32.0% Mill & Overlay 5.5 Miles $ 2,340,000 32.3% Micro-surface 11.5 Miles $ 660,000 9.1% Patching as Needed $ 250,000 3.5% Crack Sealing 10 Miles $ 75,000 1.0% Public Works Materials $ 115,000 1.6% Bridge Replacements $ 730,000 10.0% Engineering $ 540,000 7.5% Contingency $ 215,000 3.0% Total Cost $ 7,235,000 100%
Requires $607,000 in additional annual funding
infrastructure
private property AVERAGE WATER LOSS = 23% INFLOW / INFILTRATION = 137%
Total = $7,169,714.49 of $8,750,000 or 18.1% Under Budget
Contract 1 Engineering $102,632.64 Construction $1,233,990.87 Inspection/Testing $40,953.59 % Complete 98% Total Cost $1,377,577.10 Total Length (FT) 5,174.5 Cost/FT $266.22 Contract 2 Engineering $172,026.3 Construction $1,165,802.27 Inspection/Testing $68,643.80 % Complete 98% Total Cost $1,406,472.37 Total Length (FT) 8,651.5 Cost/FT $162.56
Phase B Water Improvement Project Replaced 5.6 Miles of Watermain and 432 Water Services
Contract 3 Engineering $308,481.06 Construction $3,711,395.66 Inspection/Testing $123,093.46 % Complete 95% Total Cost $4,142,970.17 Total Length (FT) 15,538.5 Cost/FT $266.62 *Total includes PRV install project not shown
1890 1900 1910 1920 1930 1940 1950 1960 ABT 1970 1980 1990 2000 2010
20,000 30,000 40,000 50,000 60,000 70,000 80,000 90,000 100,000 110,000 Total Linier Footage Installed Decade Installed 1890 - 2010
Generations of Freeport Watermain & Life Expectancy
Total Watermain 50 Years or Older = 76.7 of 137.5 Miles (55%)
255 Watermain Breaks over 10 Years
7 Locations for Watermain Failure at Rail Crossings
CIP Revenue $ 155,750,000 % of Budget Replace 87 Miles of Watermain $ 75,000,000 48.2% Line 25 Miles of Sanitary Sewer $ 25,500,000 16.4% Replace 3000 Lead Services $ 4,000,000 2.6% Replace 7 Water/Rail Crossings $ 1,000,000 0.6% Replace 4.5 Miles of Forcemain $ 3,000,000 1.9% Carroll Tank Rehabilitation $ 750,000 0.5% New Water Filtration Plant $ 10,000,000 6.4% Upgrade Wastewater Plant $ 10,000,000 6.4% Equipment/Tech Replacements $ 15,000,000 9.5% Engineering $ 11,750,000 7.5% Total CIP Cost $ 155,750,000 100%
CIP Revenue $ 23,400,000 % of Budget Replace 14.5 Miles of Watermain $ 12,500,000 53.4% Line 4 Miles of Sanitary Sewer $ 4,250,000 18.2% Replace 500 Lead Services $ 900,000 3.8% Replace 7 Water/Rail Crossings $ 1,000,000 4.3% Replace 4.5 Miles of Forcemain $ 3,000,000 12.8% Engineering $ 1,750,000 7.5% Total CIP Cost $ 23,400,000 100%
$20,710,000 / 11,500 Accounts / 5 Years / 12 months = $30.01 per Month
Sewer are not sustainable and continue to lose ground every year.
together to reduce overlapping costs.
smaller annual projects can be coordinated by existing staff with minimal overhead.
help offset long-term inflation costs.
prioritizing existing revenues, grants, energy efficiency investments, rate increases, user taxes, fines and collections.