
SLIDE 1
City of Austin, Minnesota 2015 Proposed Tax Levy and Operating - - PowerPoint PPT Presentation
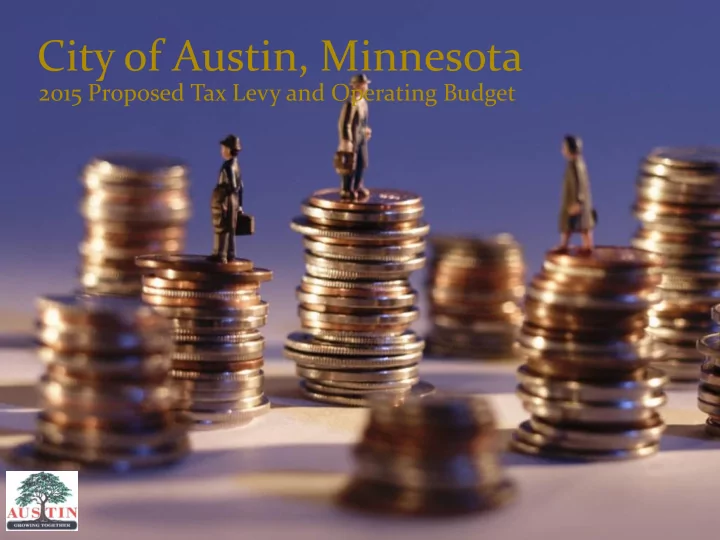
City of Austin, Minnesota 2015 Proposed Tax Levy and Operating Budget Agenda 1. Budget Timeline 11. Port Authority Projects: 2. Proposed Tax Levy APC Debt Service Fund (65000) 3. Employees and Other Property Management Fund
1. Budget Timeline 2. Proposed Tax Levy 3. Employees and Other 4. General Fund (11000) 5. Recreation Programs Fund (22000) 6. Library Fund (25000) 7. Police PERA Fund (28000), Fire PERA Fund (29000), and Economic Development Fund (23000) 8. Debt Service Funds:
(31000)
9. Capital Projects Fund (49000) 10. Enterprise Funds:
(67000)
11. Port Authority Projects:
(66000)
Fund (69000) 12. Internal Service Funds:
13. Sample Resolutions
2015
14. Sample Tax Statements 15. Tax Classification Rates
Council reviews operational budgets for the different departments.
documents sent out to department heads.
requests back from department heads.
Administrative Services meet with department heads to review budget requests.
budget brought back to council for their review.
Proposed Budget and Maximum Tax Levy for 2015.
budget discussion at work session.
budget discussion at work session.
budget discussion at work session.
Truth In Taxation documents delivered to Mayor and City Council.
ber 2, 2014 – City holds require uired Truth h In Taxatio tion n hearing ring for resid idents nts to hear where the City will be spending ing their ir tax dollar ar for 2015.
adopts tax levy and budget amounts for the payable 2015 year.
to Mower County and State of Minnesota tax levy for 2015.
General Fund $ 2,297,569 $ 2,248,392 Library Fund $ 844,500 $ 917,000 Port Authority $ 25,000 $ 40,000 Debt Service $ 152,931 $ 144,608 Capital Projects $ 800,000 $ 975,000 Total tal All l Funds $ 4,120, 20,000 000 $ 4,325, 25,000 000
The following is how your tax dollar, as a citizen of Austin, is split among the taxing entities (for Payable 2014 year): 37% City 36% County 24% School 3% Other
201 011 2012 12 2013 13 2014 14 Proposed posed 2015 15
General Government
9.80 9.80 10.30 10.80 10.80
Public Safety
48.00 48.00 48.00 49.00 49.00
Streets, Highways, and Arenas
25.50 24.50 24.50 24.50 24.50
Parks and Recreation
13.50 13.50 14.50 14.50 14.50
Library
9.55 9.80 9.80 10.80 10.80
WWTP and Sewer Maintenance
24.50 24.50 24.50 23.50 23.50
Storm Water Utility District
0.00 0.00 0.00 1.00 1.00
Central Garage
4.00 4.00 4.00 4.00 4.00
MIS Replacement
1.00 1.00 1.00 1.00 1.00
Risk Management
0.20 0.20 0.20 0.20 0.20
TOTAL ALS
136. 6.05 05 135. 5.30 30 136. 6.80 80 139. 9.30 30 139. 9.30 30
Current Property Taxes Intergovernmental Revenue Charges for Services Licenses and Permits Miscellaneous Other Taxes Fines and Forfeits Tax Increment Funds Enterprise Funds Internal Service Funds
Current Property Taxes $ 4,325,000 Intergovernmental Revenue 9,010,174 Charges for Services 476,899 Licenses and Permits 417,915 Miscellaneous 4,162,321 Other Taxes 512,500 Fines and Forfeits 225,100 Total al General ral Gove vern rnme mental al Funds ds $ 19,129 129,909 09 Tax Increments Funds 428,655 Enterprise Funds 6,603,635 Internal Service Funds 4,609,264 Grand d Total al All Funds $ 30,771 771,463 63
2,000,000 4,000,000 6,000,000 8,000,000 10,000,000 12,000,000 14,000,000 16,000,000 18,000,000 20,000,000
General Government Services 19,129,909 Tax Increment Funds 428,655 Enterprise Funds 6,603,635 Internal Service Funds 4,609,264 Expenditures
Debt Service Fund 3% Port Authority Fund 1% Library Fund 21% Capital Improvement Fund 23% General Fund 52%
500,000 1,000,000 1,500,000 2,000,000 2,500,000 3,000,000 3,500,000 4,000,000 4,500,000 5,000,000
2006 2007 2008 2009 2010 2011 2012 2013 2014 2015
1,000,000 2,000,000 3,000,000 4,000,000 5,000,000 6,000,000
General Administration Public Safety Streets and Highways Parks and Recreation Economic Development Capital Outlay and Other
General Administration $ 2,050,327 Public Safety 5,879,410 Streets and Highways 3,607,149 Parks and Recreation 2,488,480 Economic Development 201,500 Capital Outlay and Other 849,900 Total al GENERAL FUND $ 15,07 076, 6,766 766
50,000 100,000 150,000 200,000 250,000 300,000 350,000 400,000 450,000
Mayor and City Council Administration Clerk and Elections Finance and MIS Senior Center Assessor City Attorney Prosecuting Attorney Human Resources Planning/Zoning City Hall Public Relations
500,000 1,000,000 1,500,000 2,000,000 2,500,000 3,000,000 3,500,000 4,000,000 4,500,000
Police Fire Building Inspection Other
500,000 1,000,000 1,500,000 2,000,000 2,500,000
Engineering Streets Lighting Other
Other, $86,667 Arenas, $474,487 Nature Center, $354,365 Forestry, $214,517 Downtown Flowers, $40,000 Parks Maintenance, $725,393 Pool, $153,610 Recreation Admin., $439,441
Contingency, $165,500 Capital Outlay and Other, $684,400 Economic Development, $201,500
Adult Softball $ 31,000 Adult Volleyball $ 6,500 Community Gardens $ 1,900 Disc Golf $ 100 Horseshoe Club $ 1,360 Invitational Tournaments $ 2,000 Recreation Programs $ 12,000 Southern Minny Fast Pitch $ 10,000 Winter Recreation $ 1,313 Summer Recreation Programs $ 10,000 Volleyball Club $ 6,000 Youth Winter Basketball $ 450 Youth Wrestling $ 4,000 Canoeing $ 500 Crafts $ 1,200 Nature Center Donations $ 1,000 Energy Fair $ 15,000 Skiing $ 4,200 Special Events $ 8,700
Other 2% Charges for Services 1% County Contrib ution 16% Tax Levy 79% Book Fines 2%
Tax Levy $ 917,000 County Contribution 183,300 Charges for Services 10,900 Book Fines 25,000 Other 25,876 Total al LIBRARY FUND $ 1,162 162,076 76
Use of Fund Balance 100% Interest Earnings 0%
Interest Earnings $ 0 Use of Fund Balance 185,000 Total al POLICE PERA FUND $ 185, 5,000 00
This fund will be liquidated to pay for our share of a new Radio Tower for the LEC..
Interest Earnings 3% Use of Fund Balance 97%
Interest Earnings $ 10,000 Use of Fund Balance 390,000 Total al FIRE PERA FUND $ 400, 0,000 00
The expenditures in this fund will be used to pay for capital repairs at the Fire Department.
10,000 20,000 30,000 40,000 50,000 60,000 70,000 80,000 90,000 100,000
2004B Bonds 2009A Bonds
Special Assessment Debt Service 20,000 40,000 60,000 80,000 100,000 120,000 140,000 160,000 2002C Bonds 2002D Bonds 2009A Bonds
Tax Increment Debt Service
100,000 200,000 300,000 400,000 500,000 600,000 700,000 800,000
Streets Trails Sidewalk/Alley Repairs Downtown Streetscape Management Services Other
Expenditures 200,000 400,000 600,000 800,000 1,000,000 1,200,000 Tax Levy Grants Assessments Other Revenues
Expenses
Supplies, $157,200 Prof. Services, $1,089,960 Reserves, $650,000 Capital, $120,500 Wages and Benefits, $1,693,475 Other, $1,516,560
Revenues
Other, $195,000 Interest, $35,000 Industrial, $1,770,759 Domestic, $3,226,936
Repairs and Maint. 42% Capital Outlay 41% Other 17% Transfer Station Rental $ 65,000 Interest Earnings Use of Fund Balance 20,180 Total al WASTE TRANSF SFER STATIO TION FUND $ 85,18 180
Walker Building Hormel Institute
Horme rmel Instit itute General ral Walke lker r Buildin lding
Revenu enues es: Loan Interest/Leases $ 256,917 $ 8,027 $ 83,070 Property Taxes 40,000 Expen enses ses: Operating Expenses (153,027) (27,700) Non-operating Revenues (Expenses) (150,464) 105,000 Net t Income me (Loss) s) $ 106,4 ,453 $ 0 $ 55,3 ,370
Departments: – Central Garage Fund
– M.I.S. Replacement Fund – Fire Equipment Fund – Risk Management Fund
200,000 400,000 600,000 800,000 1,000,000 1,200,000 1,400,000
Health Insurance P/L Insurance W/C Insurance Sick Leave