
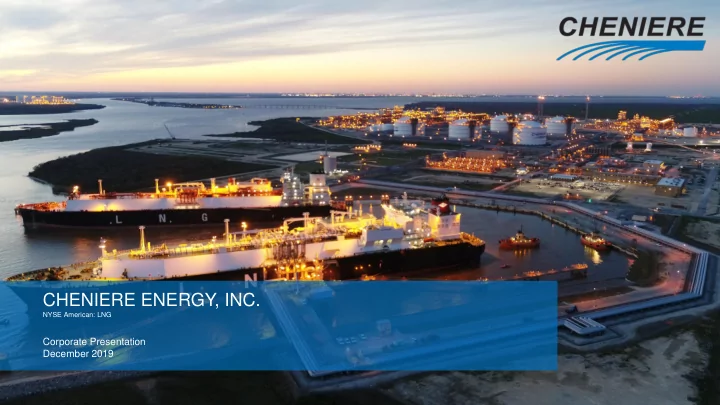
SLIDE 1
CHENIERE ENERGY, INC.
CHENIERE ENERGY, INC.
NYSE American: LNG
Corporate Presentation December 2019
CHENIERE ENERGY, INC. NYSE American: LNG Corporate Presentation - - PowerPoint PPT Presentation
CHENIERE ENERGY, INC. CHENIERE ENERGY, INC. NYSE American: LNG Corporate Presentation December 2019 Safe Harbor Statements Forward-Looking Statements This presentation contains certain statements that are, or may be deemed to be, forward
NYSE American: LNG
Corporate Presentation December 2019
2
Forward-Looking Statements This presentation contains certain statements that are, or may be deemed to be, “forward-looking statements” within the meaning of Section 27A of the Securities Act of 1933, as amended, and Section 21E of the Securities Exchange Act of 1934, as
thereof, by certain dates or at all;
regardless of the source of such information, or the transportation or other infrastructure, or demand for and prices related to natural gas, LNG or other hydrocarbon products;
procurement and construction ("EPC") contractor or other contractor and the anticipated terms and provisions of any agreement with any EPC or other contractor, and anticipated costs related thereto;
regasification, natural gas, liquefaction or storage capacities that are, or may become, subject to contracts;
cash flows, EBITDA, Adjusted EBITDA, distributable cash flow, and distributable cash flow per share and unit, any or all of which are subject to change;
These forward-looking statements are often identified by the use of terms and phrases such as “achieve,” “anticipate,” “believe,” “contemplate,” “develop,” “estimate,” “example,” “expect,” “forecast,” “goals,” ”guidance,” “opportunities,” “plan,” “potential,” “project,” “propose,” “subject to,” “strategy,” “target,” and similar terms and phrases, or by use of future tense. Although we believe that the expectations reflected in these forward-looking statements are reasonable, they do involve assumptions, risks and uncertainties, and these expectations may prove to be incorrect. You should not place undue reliance on these forward-looking statements, which speak only as of the date of this presentation. Our actual results could differ materially from those anticipated in these forward-looking statements as a result of a variety of factors, including those discussed in “Risk Factors” in the Cheniere Energy, Inc. and Cheniere Energy Partners, L.P. Annual Reports on Form 10-K filed with the SEC on February 26, 2019, which are incorporated by reference into this presentation. All forward-looking statements attributable to us or persons acting on our behalf are expressly qualified in their entirety by these ”Risk Factors.” These forward-looking statements are made as of the date of this presentation, and other than as required by law, we undertake no obligation to update or revise any forward-looking statement or provide reasons why actual results may differ, whether as a result of new information, future events or otherwise. Reconciliation to U.S. GAAP Financial Information The following presentation includes certain “non-GAAP financial measures” as defined in Regulation G under the Securities Exchange Act of 1934, as amended. Schedules are included in the appendix hereto that reconcile the non-GAAP financial measures included in the following presentation to the most directly comparable financial measures calculated and presented in accordance with U.S. GAAP.
Sabine Pass Liquefaction Train 5 Completed March DFCD Achieved September Train 6 Full NTP June Increased Run-Rate Production and Guidance Integrated Production Marketing (IPM) Transactions 0.85 mtpa – 15 years 0.85 mtpa – 15 years
4
Note: Consolidated Adjusted EBITDA and Distributable Cash Flow are non-GAAP measures. A definition of these non-GAAP measures is included in the appendix. We have not made any forecast of net income on a run-rate basis, which would be the most directly comparable measure under GAAP, and we are unable to reconcile differences between these run-rate forecasts and net income. DFCD – Date of First Commercial Delivery.
Capital Allocation Framework ✓ Invest in accretive growth projects ▪ SPL T6, Corpus Stage 3, debottlenecking projects ✓ Strengthen our balance sheet ▪ Reduce consolidated debt $3-4B ▪ Target investment grade ratings at CEI ✓ Return capital to shareholders ▪ 3-year $1B share repurchase program Long-Term Customers Onboarded Positive Final Investment Decision Sabine Pass Train 6
($ billions, production mtpa per Train)
Production (20-year avg.) 4.4
4.7
Consolidated Adjusted EBITDA $4.4
$5.2
Distributable Cash Flow $2.1
$2.5
Old New
FERC Approval Received Corpus Christi Stage 3 Corpus Christi Liquefaction Train 1 Completed February DFCD Achieved June Train 2 Completed August Execution Growth Financial
5
Focus on long-term relationships with 13 long-term customer contracts in effect and 7 more to begin in early 2020s Commercial innovation with FOB, DES, and IPM contracts
Track record for completing Trains safely, on time, and on budget History of increasing total production capacity Reliable production and stability of operations Leverage expansive infrastructure footprint,
sheet strength Extensive infrastructure and land position at Corpus Christi site provides opportunity for further capacity expansion Invest in accretive growth projects, such as SPL T6, Corpus Stage 3, and debottlenecking Strengthen our balance sheet and ensure resiliency of investment-grade metrics Capital return to shareholders via share repurchase program
6
(1) Each Train is expected to have a nominal production capacity, prior to adjusting for planned maintenance, production reliability, potential overdesign, and debottlenecking opportunities, of approximately 4.5 mtpa of LNG and an average adjusted nominal production capacity of approximately 4.7-5.0 mtpa
▪ Trains 1-5 operating, contracts with long-term buyers
commenced
▪ Train 6 under construction, est. completion 1H 2023
~30 mtpa(1) Liquefaction Capacity
▪ First greenfield LNG export facility in U.S. Lower-48 ▪ Train 1 operating, contracts with long-term buyers
commenced
▪ Train 2 operating, completed August 2019 ▪ Train 3 under construction, est. completion 1H 2021 ▪ FERC approval for ~10 mtpa Stage 3 expansion project
received November 2019
▪ Land position enables significant further liquefaction
capacity expansion
~15 mtpa(1) Liquefaction Capacity ~1,500 Employees 6 Offices Worldwide
Houston | Washington D.C. | London Tokyo | Beijing | Singapore
7
▪ Significant consumer of U.S. natural gas ▪ Capacity holder on most Gulf Coast
interstate pipelines, largest shipper on Transco and KMLP
▪ Over 3,300 TBtu nominated to SPL/CCL,
with near-perfect scheduling efficiency
▪ Established relationships with major
producers and marketers, executed enabling agreements with over 200 counterparties
▪ Second largest operator of liquefaction
capacity in the world
▪ Approximately 40% of U.S. LNG export
capacity either in operation or under construction
▪ Firm portfolio volumes used to structure term
deals to enable long-term growth
▪ Platform for continued capacity expansion ▪ Loaded over 200 vessels in 2017, over 270
in 2018, and over 325 in 2019(1)
▪ Cheniere Marketing delivered
approximately 350 cargoes to date
▪ Chartered more than 170 LNG carriers
since startup, with up to 30 on the water simultaneously
GAS SUPPLY LIQUEFACTION PORTFOLIO OPTIMIZATION
Strong relationships, scale and diversity difficult to replicate Best-in-class operations, economically- advantaged expansion opportunities Commercial flexibility and global market access unlock value
(1) Cargoes exported as of October 31, 2019.
8
(1) Excludes IPM transactions with Apache and EOG Resources.
2 4 6 8 10 Q2 2018 Q3 2018 Q4 2018 Q1 2019 Q2 2019 Q3 2019 Asia Latin America Europe MENA
9
Sources: Cheniere Research, Kpler Note: Cumulative cargoes and volumes as of October 31, 2019. MENA – Middle East & North Africa
Houston, TX Washington, DC London, U.K. Singapore Tokyo, Japan Beijing, China
MT
Construction Time: FID to Project Startup
Seven trains brought online ahead of schedule and within budget with a 42-44 month construction time
Corpus Christi Trains 1 & 2 Sabine Pass Train 5 O Sabine Pass Trains 1 & 2 Sabine Pass Train 3 & 4 O O U U O O O O O U O O O O U U O U O 10 20 30 40 50 60 70 80 90 Months U.S. ROW O = Operational U = Under Construction
Became the 2nd Largest Global LNG Operator in 2019
Data represent nameplate capacities
10
Became the 4th Largest Global LNG Supplier in 2019
Volumes for projects existing and under construction
Note: Suppliers chart excludes suspended projects. Where players are selling to each other, e.g., where Cheniere sells to Shell, the contracts are counted twice. Operators chart data represent nameplate capacities. Capacities and volumes shown above for full year 2020. Source: Cheniere interpretation of Wood Mackenzie data (Q4 2019; only companies included in the Corporate Service) Note: Excludes Corpus Christi Train 3 and Sabine Pass Train 6, currently under construction. Source: Cheniere interpretation of Wood Mackenzie data (Q4 2019)
10 20 30 40 50 60 70 80 90
Qatargas Shell PETRONAS Cheniere Total Chevron Naturgy BP
mtpa 10 20 30 40 50 60 70 80
Qatargas Cheniere Petronas Sonatrach Chevron Woodside Badak Nigeria LNG
mtpa
11
(1) Volumes are approximate. For some SPAs, a portion of the total volume may be supplied over a period that is shorter than the entire contract term. (2) PetroChina entered into two LNG SPAs with Cheniere subsidiaries for an aggregate volume of ~1.2 mtpa, with a portion of the supply beginning in 2018 and the balance beginning in 2023. (3) LNG volume associated with the gas supply volume.
Counterparty Structure LT Volume (mtpa)
1
Start Term Allocated Train (year) (years)
1
FOB 1.00 2019 15 CCL T3 FOB/DES 1.20
2
2018 25 CCL T3
CPC Corporation
DES 2.00 2021 25 CMI FOB 0.70 2018 15 SPL T6 DES 1.45 2019 24 CMI FOB 1.10 2024 20 SPL T6 IPM 0.85
3
~2023 ~15 CCL Stage 3 IPM 0.85
3
2020 ~15 CCL Stage 3 Total 9.15
Depth of expertise and portfolio provide major competitive advantages
✓ Delivered Volumes ✓ Price and Volume Flexibility ✓ Early Volumes
9 Trains, ~45 mtpa adjusted nominal capacity
Corpus Stage 3 regulatory approval complete Additional capacity in development
Early Volumes Additional Term Offtake
(FOB, DES, IPM)
Short and Mid- Term Monetization
80-95% contracted
▪ Producers will sell natural gas to Cheniere (Corpus Christi) on a long-term basis ▪ Cheniere will market the LNG associated with the gas supply ▪ Producers realize a gas price based on global gas market price less fixed liquefaction fee and certain costs incurred by Cheniere
12
Provides producers long-term, reliable market ensuring gas flows
Producers obtain diversity of pricing versus NYMEX or local prices
Generates a take-or-pay style fixed liquefaction fee for Cheniere from creditworthy counterparties, similar to standard HH-linked LNG deal ▪ Secures supply for Corpus Christi and leverages Cheniere’s access to global gas market prices Global Gas Market Prices Less Fixed Liquefaction Fee & Certain Other Costs
Natural Gas LNG Global Gas Market Prices
13
Stage 3 Future Development Potential Shared
(currently in operation or under construction)
Stage 1 Stage 2
Corpus Christi
Artist rendering
Stage 3
14
Corpus Christi Liquefaction Terminal Sabine Pass Liquefaction Project
16
Note: SPA counterparties exclude SPAs with Cheniere Marketing which have not been assigned to a specific Train or project.
5 1
SPL CCL
17
4.3 MTPA 4.6 MTPA 4.4 MTPA 4.9 MTPA 5.0 MTPA 4.7 MTPA 4.0 4.1 4.2 4.3 4.4 4.5 4.6 4.7 4.8 4.9 5.0
3
SPL CCL
4
SPL CCL
18
Sabine Pass Train 6 in foreground
Note: Cumulative cargoes as of October 31, 2019. Project completion percentages as of September 30, 2019. Total investment excludes cost of regasification assets and the Creole Trail Pipeline.
✓ ~800 cargoes produced and exported Growth ✓ Train 6 positive FID May 2019 ▪ Expected completion 1H 2023 ▪ Project completion 38.1% ✓ 3rd berth Environmental Assessment received
19
Corpus Christi Train 3 in foreground
Note: Cumulative cargoes as of October 31, 2019. Project completion percentages as of September 30, 2019.
✓ >50 cargoes produced and exported Growth ✓ Train 3 under construction ▪ Expected completion 1H 2021 ▪ Project completion 68.6% ✓ FERC approval for ~10 mtpa Stage 3 expansion received November 2019 ✓ Land position enables significant further liquefaction capacity expansion
YoY LNG Supply Growth per Quarter
2 4 6 8 10 12 14
Q1 Q2 Q3 Q4 Q1 Q2 Q3 Q4 Q1 Q2 Q3 Q4 Q1 Q2 Q3 2016 2017 2018 2019
21
Europe Continued Absorbing Market Oversupply
LNG Imports: Europe
LNG Demand Growth LNG Capacity Additions
1Q16 – 3Q18 Avg.
MT Shaded capacity represents projects under construction
4Q18 – 3Q19 Avg.
Note: Five-year ranges cover 2014-2018. European imports chart includes Turkey. Source: Cheniere interpretation of Wood Mackenzie (3Q 2019) and Kpler data
3 6 9 Jan Feb Mar Apr May Jun Jul Aug Sep Oct Nov Dec
MT
5-Yr Range 2018 2019
314 351 375 389 400 408
250 275 300 325 350 375 400 425 450 2018 2019 2020 2021 2022 2023
MT
10 15 20 25 30 35 40 45 2018 2019 2020 2021 2022 2023 mtpa Atlantic Basin Pacific Basin
Commodity Prices
Forward Curves 5 10 15 Jan-18 Apr-18 Jul-18 Oct-18 Jan-19 Apr-19 Jul-19 Oct-19 Jan-20 Apr-20 Jul-20 $/MMBtu Henry Hub Brent TTF Asia LNG Spot
22
Source: Cheniere Research, Kpler for trade data, Bloomberg, CME, ICE, Platts, Japan Ministry of Finance
Year over Year Supply / Demand Variance 2019 Incremental Global LNG Supply/Demand
3Q 2018 vs. 3Q 2019
6.7 2.6 2.3 (0.7) (1.2) 9.75
2 4 6 8 10 12 14 Europe (ex-NW) Asia NW Europe MENA Americas LNG Supply MT
LNG Demand LNG Supply
Other AUS Rest of US RUS Cheniere
2 4 6 8 10 12 14 1Q 2018 2Q 2018 3Q 2018 4Q 2018 1Q 2019 2Q 2019 3Q 2019 MT
Global Supply Asia Demand European imports increased to a record 18.4 MT in 3Q, nearly double prior year Asian demand increased due to demand growth in South and SE Asia, despite declines in Japan and South Korea MENA imports decreased due to increased East Mediterranean gas output and the end of Egyptian LNG imports Americas demand decreased due to declines in Argentina, Brazil, and Chile
23
Sources: GIE, Kpler, Commodity Essentials via ENTSO, Bloomberg Note: Monthly storage balances reflect end of month levels
Total Pipeline Flows LNG Imports in Europe Gas Storage in Europe Gas Power Generation in Europe
500 1000 1500 2000 Q3 2018 Q3 2019 aGWh/d Germany France Italy Spain 1 2 3 4 5 6 7 8 9 Jan Feb Mar Apr May Jun Jul Aug Sep Oct Nov Dec MT 5-Yr Range 2018 2019
LNG supply wave absorbed largely by Europe, pushing LNG prices down and gas storage levels up, and incentivizing gas power generation Market currently balanced heading into winter withdrawal season Reduced pipeline flows and negative news flow on Groningen, French nuclear fleet, and lack of progress on Ukraine transit agreement present potential tailwinds
25 50 75 100 Jan Feb Mar Apr May Jun Jul Aug Sep Oct Nov Dec % of Full 5-Yr Range 2019 2018 20 22 24 26 28 30 32 34 Jan Feb Mar Apr May Jun Jul Aug Sep Oct Nov Dec Bcf/d 2016 2017 2018 2019
24
Sources: Cheniere Research, Kpler, MEE Note: South Asia includes India, Pakistan, Bangladesh; Southeast Asia includes Thailand, Indonesia, Malaysia, Singapore
China Coal-Fired Power Capacity Asia Imports Year over Year
3Q 2019 vs. 3Q 2018
Asia LNG Imports
10 15 20 25 Jan Feb Mar Apr May Jun Jul Aug Sep Oct Nov Dec MT 5-Yr Range 2018 2019
▪ Asia LNG imports grew 5% year over year due to higher imports into China and South and Southeast Asia, despite downward pressure in Japan, Korea and Taiwan due to strong nuclear generation ▪ Strict nuclear retrofit requirements in Japan and anti-pollution efforts in China and South Korea offer upside to Asia LNG demand
1 2 3 S & SE Asia China JKT MT Bangladesh India Indonesia Malaysia Pakistan Singapore Thailand
China Gas-Fired Power Capacity
0% 10% 20% 30% 40% 50% 60% 70% 200 400 600 800 1000 1200 GW Coal Capacity Coal Share in Power Capacity Mix 0.0% 0.5% 1.0% 1.5% 2.0% 2.5% 3.0% 3.5% 4.0% 4.5% 5.0% 10 20 30 40 50 60 70 80 90 100 GW Gas Capacity Gas Share in Power Capacity Mix
Lower 48 Dry Gas Production
70 75 80 85 90 95
Jan Feb Mar Apr May Jun Jul Aug Sep Oct Nov Dec 2018 2019
25
Top Global LNG Suppliers
(YTD through 3Q19)
Projected Growth by Basin Through December 2020 Henry Hub Forward Curves
MT
Source: Genscape, Bloomberg, SpringRock, Cheniere Research as of 3Q 2019.
Bcf/d Bcf/d
The US is now a top-3 global LNG supplier
+~6.0 Bcf/d YoY
2019 to be one of the largest YoY Bcf/d increase in gas production Permian is the fastest growing basin in the world Henry Hub curve under $3 until late 2020s
1.4 0.8 (0.4) (1.1) 0.7 (2) (1) 1 2 Permian Haynesville Marcellus/Utica Other Total 60 58 26 22 19 16 10 10 20 30 40 50 60 70
Qatar Australia USA Russia Malaysia Nigeria Trinidad
2.25 2.75 3.25 3.75
2019 2020 2021 2022 2023 2024 2025 2026 2027 2028 2029 2030 Current Strip 3 Months Ago 1 Year Ago
Global LNG Supply
Qatar Australia USA
100 200 300 400 500 600 2000 2005 2010 2015 2020 2025 2030 LNG Trade Forecast
Russia
26
Source: Cheniere Research estimates; Wood Mackenzie for historical figures Area chart includes all recent FIDs to September 5, 2019 such as Golden Pass, SPL T6, Mozambique LNG, Calcasieu Pass and Arctic LNG 2
LNG Projected Demand Growth by Region 2018 to 2030 Over 230 mtpa of Demand Growth Projected
mtpa
Supply: Existing and Under Construction New Supply +100 mtpa 2018 to 2030 CAGR: 4.8% 49 43 15 13 8 7 5
IN PK BD LK TH ID MY SG VN PH
10 20 30 40 50 60 S.Asia China Europe S.E.Asia Bunkers MENA Latam JKT (net) Other
mtpa
Philippines (PH) Vietnam (VN) Singapore (SG) Malaysia (MY) Sri Lanka (LK) 52 40
28
Note: YTD through September 30 of each respective year. Consolidated Adjusted EBITDA and Distributable Cash Flow are non-GAAP measures. A definition of these non-GAAP measures and a reconciliation to Net income (loss) attributable to common stockholders, the most comparable U.S. GAAP measure, is included in the appendix. 1. Reported as Net income (loss) attributable to common stockholders and Net income (loss) per share attributable to common stockholders – diluted on our Consolidated Statement of Operations. 2. Long-term SPAs as referred to above includes any contract with an initial term of at least 15 years.
($ millions, except per share and LNG data)
3Q 2019 2Q 2019 YTD 2019 YTD 2018 Revenues $2,170 $2,292 $6,723 $5,604 Operating Income $307 $432 $1,345 $1,508 Net Income (Loss) 1 $(318) $(114) $(291) $404 Net Income (Loss) per Share 1 $(1.25) $(0.44) $(1.13) $1.65 Consolidated Adjusted EBITDA $694 $615 $1,959 $2,007 LNG Exported LNG Volumes Exported (TBtu) 383 361 1,054 691 LNG Cargoes Exported 108 104 299 193 LNG Volumes Recognized in Income (TBtu) LNG Volumes from Liquefaction Projects 364 352 998 731 Third-Party LNG Volumes 8 5 31 44
73% of LNG volumes recognized in income in 3Q 2019 from our projects sold under long-term SPAs(2) 3Q 2019 Distributable Cash Flow ~$200 million YTD Distributable Cash Flow ~$520 million Date of first commercial delivery achieved under 20-year SPAs with Total and Centrica for Sabine Pass Train 5 3Q 2019 net loss impacted by non-cash loss from changes in fair value of commodity and interest rate derivatives and impairment of equity method investment in Midship
29
Note: Consolidated Adjusted EBITDA and Distributable Cash Flow are non-GAAP measures. A definition of these non-GAAP measures and a reconciliation to Net income attributable to common stockholders, the most comparable U.S. GAAP measure, is included in the appendix.
($ billions, except per unit data)
Consolidated Adjusted EBITDA $2.9
Distributable Cash Flow $0.6
CQP Distribution per Unit $2.35
($ billions, except per unit data)
Consolidated Adjusted EBITDA $3.8
Distributable Cash Flow $1.0
CQP Distribution per Unit $2.55
Stable operations with seven Trains in service through the entire year SPAs currently in effect for six Trains
Of total volume produced at Cheniere facilities in 2020, we expect approximately 7.5 million tonnes available for marketing
sold physically or financially
efforts, and 2019 debottlenecking projects
Forecast $1 change in market margin would impact 2020 Consolidated Adjusted EBITDA by ~$100 million
30
Note: Debt maturities as of November 13, 2019, the date of closing of the CCH Senior Secured Notes due 2029, excludes working capital facilities and revolving credit facilities. CEI and CCH Convertible Notes shown at maturity date at value of total principal plus PIK interest due at estimated time of
CQP issued $1.5B 4.50% Senior Notes due 2029
To term out CQP term loan balance and for general corporate purposes, including construction cost of Sabine Pass Train 6 Bolsters SPL credit metrics and de-securitizes balance sheet
CCH received investment grade credit ratings
Investment grade senior secured ratings of BBB- from Fitch and S&P and investment grade issuer default rating of BBB- from Fitch
Through 3Q 2019 repurchased ~2.5MM shares for $159MM and prepaid $70MM of outstanding debt under CCH credit facility
CCH issued $727MM 4.80% Senior Secured Notes due 2039 and $475MM 3.925% Senior Secured Notes due 2039
Private placement transactions with Allianz, BlackRock, and MetLife Proceeds used to term out balances under Corpus credit facility Fully amortizing with weighted average life of 15 years, will strengthen project-level credit metrics and reduce consolidated leverage over time
$1.2 $1.3 $1.5 $1.5 $1.5 $3.3 $1.4 $1.6 $0.6 $4.6 $3.1 $0.0 $2.0 $4.0 $6.0 $8.0 $10.0 2019 2020 2021 2022 2023 2024 2025 2026 2027 2028 2029 … 2039 … 2045 CEI and CCH Convertible Notes CCH - Credit Facility CCH - Senior Bullet Notes CCH - Amortizing Notes $0.8 $2.0 $1.0 $1.5 $2.0 $2.0 $1.5 $1.5 $1.4 $1.5 $1.1 $1.5 $3.5 $2.6 $0.0 $2.0 $4.0 $6.0 $8.0 $10.0 2019 2020 2021 2022 2023 2024 2025 2026 2027 2028 2029 … 2037 CQP - Senior Bullet Notes SPL - Senior Bullet Notes SPL - Amortizing Notes
CCH issued $1.5B 3.70% Senior Secured Notes due 2029
Inaugural investment grade bond issuance at CCH to term out balances under Corpus credit facility
($bn, except per share and per unit amounts or unless otherwise noted)
31
Note: Numbers may not foot due to rounding. Range driven by production and assumes CMI margin of $2.50/MMBtu, 80/20 profit-sharing tariff with SPL/CCH. Interest rates at SPL and CCH for refinancings assumed to be 5.50%. Average tax rate as percentage of pre-tax cash flow expected to be 0-5% in the 2020s and 15-20% in the 2030s. Consolidated Adjusted EBITDA, Distributable Cash Flow, Distributable Cash Flow per Share and Distributable Cash Flow per Unit are non-GAAP measures. A definition of these non-GAAP measures is included in the appendix. We have not made any forecast of net income on a run-rate basis, which would be the most directly comparable measure under GAAP, and we are unable to reconcile differences between these run-rate forecasts and net income. (1) Assumed share count of ~300mm shares pro-forma for conversion of CEI and CCH Convertible Notes.
9 Trains 9 Trains + CCL Stage 3 (2023) (2026)
($bn, except per share and per unit amounts or unless otherwise noted)
SPL T1-6, CCL T1-3 + CCL Stage 3 (2) SPL T1-6, CCL T1-3 + Stage 3
CEI Consolidated Adjusted EBITDA $5.2 - $5.6 $0.9 - $1.1 $6.0 - $6.6 Less: Distributions to CQP Non-Controlling Interest ($0.9) - ($1.0) $0.0 ($0.9) - ($1.0) Less: CQP Interest Expense / SPL Interest Expense / Other ($1.1) $0.0 ($1.1) Less: CEI Interest Expense / CCH Interest Expense / Other ($0.7) ($0.2) ($0.9) CEI Distributable Cash Flow $2.5 - $2.9 $0.6 - $0.8 $3.1 - $3.7 CEI Distributable Cash Flow per Share(1) $8.40 - $9.60 $2.10 - $2.90 $10.50 - $12.50
nit amounts or unless otherwise noted)
32
Note: Numbers may not foot due to rounding. ‘9 Trains Online’ and ‘9 Trains Online + Stage 3’ range driven by production and assumes CMI margin of $2.50/MMBtu, 80/20 profit-sharing tariff with SPL/CCH. Stage 3 range driven by production and contracting margin / volume. Interest rates at SPL and CCH for refinancings assumed to be 5.50%. Guidance shown prior to impact of debt paydown and share repurchases. Average tax rate as percentage of pre-tax cash flow expected to be 0-5% in the 2020s and 15-20% in the 2030s. Consolidated Adjusted EBITDA, Distributable Cash Flow and Distributable Cash Flow per Share are non-GAAP measures. We have not made any forecast of net income on a run-rate basis, which would be the most directly comparable measure under GAAP, and we are unable to reconcile differences between these run-rate forecasts and net income. (1) Assumed share count of ~300mm shares pro-forma for conversion of CEI and CCH Convertible Notes. (2) Assumes 50 / 50 debt / equity funding.
33
Unprecedented period of investment
$0 $5 $10 $15 $20 $25 $30 Sep-12 Mar-13 Sep-13 Mar-14 Sep-14 Mar-15 Sep-15 Mar-16 Sep-16 Mar-17 Sep-17 Mar-18 Sep-18 Mar-19 Sep-19 Mar-20 Sep-20 Mar-21 Sep-21 Mar-22 Sep-22 Mar-23
Cumulative spend ($bn) Unlevered Spend - Total SPL and CCH Project
~$25BN Invested to Date ~$3BN Remaining Investment 34
Annual EBITDA ramping Accretive brownfield opportunities remain priority
($mm)
$0 $1,000 $2,000 $3,000 $4,000 $5,000 $6,000 2016A 2017A 2018A 2019E 2020E 9-Train Run-Rate
Consolidated Adjusted EBITDA
~5 Mtpa ~10 Mtpa ~20 Mtpa
Strategic to be a creditworthy counterparty at our scale Evolution of LNG commercial offering keeps Cheniere at forefront Path in place to be Investment Grade at all entities
✓ Significant consumer of natural gas in the U.S. ✓ Top charterer of LNG vessels in 2018 (short-term fixtures) ✓ 2nd largest operator of LNG globally ✓ Substantial firm capacity holder on U.S. interstate pipelines
2004 2012 2018 2019 FOB DES IPM Tolling (Regas) 9-Train Run-Rate Growth & Balance Sheet
BBB Range
Mid 5.0x's Mid to High 4.0x's
BB Range
Consolidated Debt / EBITDA
35
36
37
$1.2 $1.3 $1.5 $1.5 $1.5 $3.3 $1.4 $1.6 $0.6 $4.6 $3.1 $0.0 $2.0 $4.0 $6.0 $8.0 $10.0 2019 2020 2021 2022 2023 2024 2025 2026 2027 2028 2029 … 2039 … 2045 CEI and CCH Convertible Notes CCH - Credit Facility CCH - Senior Bullet Notes CCH - Amortizing Notes
$0.8 $2.0 $1.0 $1.5 $2.0 $2.0 $1.5 $1.5 $1.4 $1.5 $1.1 $1.5 $3.5 $2.6 $0.0 $2.0 $4.0 $6.0 $8.0 $10.0 2019 2020 2021 2022 2023 2024 2025 2026 2027 2028 2029 … 2037 CQP - Senior Bullet Notes SPL - Senior Bullet Notes SPL - Amortizing Notes
($bn)
38
Note: Debt maturities as of November 13, 2019, the date of closing of the CCH Senior Secured Notes due 2029, excludes working capital facilities and revolving credit facilities. CEI and CCH Convertible Notes shown at maturity date at value of total principal plus PIK interest due at estimated time of conversion. Estimated conversion date may be prior to maturity date.
($bn)
Current 9-Train Run-Rate With CCL Stage 3 FID With Balance Sheet Strategy
Mid 5x Range Low 5x Range Mid-to-High 4x Range
Corpus Stage 3 Financed 50/50 Debt/Equity Consolidated Debt Reduction ~$3-$4B
5.0x 4.0x 3.0x 2.0x 1.0x –
Consolidated Debt / EBITDA
Project Level Maturities
✓ Senior Secured Bonds at Project Level ✓ Senior Unsecured Bonds at Corporate Level ✓ Repayment with cash flow ▪ Repayment commenced in Q3 with CCH Credit Facility as part of capital allocation strategy
Goal
▪ Delever projects to remain comfortably in BBB range and provide ratings upside
39
41
We promote and follow peer-reviewed science to assess our impacts, anchor our engagements, and determine our actions We support climate science and research through our engagements with research entities and think tanks to inform policies and decision- making.
We work with our partners to reduce environmental impacts throughout our supply chain As the largest domestic consumer of natural gas, we connect U.S. producers to global markets. We work with our natural gas suppliers to share best practices and research, and to promote a low emissions profile for Cheniere’s LNG. We design and operate our facilities to reduce environmental impacts Sustainability efforts begin on the ground. We employ environmental prudence, scientific research, and technological advancements to ensure disciplined operations and excellence. We communicate openly and proactively with
Engagements with our stakeholders must be respectful, transparent, and factual. Transparent performance reporting will be the basis of building trust.
42
Note: This organizational chart is provided for illustrative purposes only, is not and does not purport to be a complete organizational chart of Cheniere. CEI and CCH Convertible Notes shown at value of total principal plus PIK interest due at estimated time of conversion. Estimated conversion date may be prior to maturity date. Debt balances as of November 13, 2019, the date of closing of the CCH Senior Secured Notes due 2029. (1) Unrestricted cash balance as of September 30, 2019. Includes unrestricted cash of $1.7 billion held by Cheniere Energy Partners, L.P. (2) Includes Cheniere CCH Holdco I and II and Cheniere Corpus Christi Holdings
Cheniere Energy, Inc. (NYSE American: LNG) Cheniere Energy Partners, L.P. (NYSE American: CQP) Sabine Pass LNG Sabine Pass Liquefaction Cheniere Creole Trail Pipeline Cheniere Corpus Christi Holdcos(2) Corpus Christi Liquefaction CQP GP (& IDRs)
Publicly Traded Equity Operating Entity Non-Operating Entity
Cheniere Corpus Christi Pipeline
Cash Balance: ~$2.5B(1)
Cheniere Energy Partners, L.P. $1.5B Notes due 2025 (5.250%) $1.1B Notes due 2026 (5.625%) $1.5B Notes due 2029 (4.500%) $0.75B Senior Secured Revolving Credit Facility due 2024 Sabine Pass Liquefaction, LLC $2.0B Notes due 2021 (5.625%) $1.0B Notes due 2022 (6.250%) $1.5B Notes due 2023 (5.625%) $2.0B Notes due 2024 (5.750%) $2.0B Notes due 2025 (5.625%) $1.5B Notes due 2026 (5.875%) $1.5B Notes due 2027 (5.000%) $1.35B Notes due 2028 (4.200%) $0.8B Notes due 2037 (5.000%) $1.2B Working Capital Facility due 2020 Cheniere Energy, Inc. $1.4B PIK Convertible Notes due 2021 (4.875%) $0.63B Convertible Notes due 2045 (4.250%) $1.25B Senior Secured Revolving Credit Facility due 2022 Cheniere CCH Holdco II, LLC $1.6B Senior Secured Convertible Notes due 2025 Cheniere Corpus Christi Holdings, LLC ~$3.3B Credit Facility due 2024 $1.25B Notes due 2024 (7.000%) $1.5B Notes due 2025 (5.875%) $1.5B Notes due 2027 (5.125%) $1.5B Notes due 2029 (3.700%) $0.73B Notes due 2039 (4.800%) $0.48B Notes due 2039 (3.925%) $1.2B Working Capital Facility due 2023
Cheniere Marketing
43
Regulation G Reconciliations This presentation contains non-GAAP financial measures. Consolidated Adjusted EBITDA, Distributable Cash Flow, Distributable Cash Flow per Share, and Distributable Cash Flow per Unit are non-GAAP financial measures that we use to facilitate comparisons of operating performance across periods. These non- GAAP measures should be viewed as a supplement to and not a substitute for our U.S. GAAP measures of performance and the financial results calculated in accordance with U.S. GAAP and reconciliations from these results should be carefully evaluated. Consolidated Adjusted EBITDA represents net income (loss) attributable to Cheniere before net income (loss) attributable to the non-controlling interest, interest, taxes, depreciation and amortization, adjusted for certain non-cash items, other non-operating income or expense items, and other items not
to represent cash flows from operations or net income (loss) as defined by U.S. GAAP and is not necessarily comparable to similarly titled measures reported by other companies. We believe Consolidated Adjusted EBITDA provides relevant and useful information to management, investors and other users of our financial information in evaluating the effectiveness of our operating performance in a manner that is consistent with management’s evaluation of business performance. We believe Consolidated Adjusted EBITDA is widely used by investors to measure a company’s operating performance without regard to items such as interest expense, taxes, depreciation and amortization which vary substantially from company to company depending on capital structure, the method by which assets were acquired and depreciation policies. Further, the exclusion of certain non-cash items, other non-operating income or expense items, and items not otherwise predictive or indicative of ongoing operating performance enables comparability to prior period performance and trend analysis. Consolidated Adjusted EBITDA is calculated by taking net income (loss) attributable to common stockholders before net income (loss) attributable to non- controlling interest, interest expense, net of capitalized interest, changes in the fair value and settlement of our interest rate derivatives, taxes, depreciation and amortization, and adjusting for the effects of certain non-cash items, other non-operating income or expense items, and other items not otherwise predictive or indicative of ongoing operating performance, including the effects of modification or extinguishment of debt, impairment expense and loss on disposal of assets, changes in the fair value of our commodity and foreign currency exchange (“FX”) derivatives and non-cash compensation expense. We believe the exclusion of these items enables investors and other users of our financial information to assess our sequential and year-over-year performance and operating trends on a more comparable basis and is consistent with management’s own evaluation of performance. Distributable Cash Flow is defined as cash received, or expected to be received, from Cheniere’s ownership and interests in CQP and Cheniere Corpus Christi Holdings, LLC, cash received (used) by Cheniere’s integrated marketing function (other than cash for capital expenditures) less interest, taxes and maintenance capital expenditures associated with Cheniere and not the underlying entities. Management uses this measure and believes it provides users of
Distributable Cash Flow per Share and Distributable Cash Flow per Unit are calculated by dividing Distributable Cash Flow by the weighted average number of common shares or units outstanding. We believe Distributable Cash Flow is a useful performance measure for management, investors and other users of our financial information to evaluate our performance and to measure and estimate the ability of our assets to generate cash earnings after servicing our debt, paying cash taxes and expending sustaining capital, that could be used for discretionary purposes such as common stock dividends, stock repurchases, retirement of debt, or expansion capital
generate cash earnings to supplement the comparable GAAP measure. Distributable Cash Flow is not intended to represent cash flows from operations or net income (loss) as defined by U.S. GAAP and is not necessarily comparable to similarly titled measures reported by other companies. Non-GAAP measures have limitations as an analytical tool and should not be considered in isolation or in lieu of an analysis of our results as reported under GAAP, and should be evaluated only on a supplementary basis.
Consolidated Adjusted EBITDA The following table reconciles our Consolidated Adjusted EBITDA to U.S. GAAP results for the three and nine months ended September 30, 2019 and 2018 and the three months ended June 30, 2019 (in millions):
Three Months Ended Nine Months Ended September 30, June 30, September 30, 2019 2018 2019 2019 2018
Net income (loss) attributable to common stockholders $ (318 ) $ 65 $ (114 ) $ (291 ) $ 404 Net income attributable to non-controlling interest 58 162 116 370 573 Income tax provision (benefit) (3 ) 3 — — 15 Interest expense, net of capitalized interest 395 221 372 1,014 653 Loss on modification or extinguishment of debt 27 12 — 27 27 Derivative loss (gain), net 78 (23 ) 74 187 (132 ) Other expense (income) 70 (15 ) (16 ) 38 (32 ) Income from operations $ 307 $ 425 $ 432 $ 1,345 $ 1,508 Adjustments to reconcile income from operations to Consolidated Adjusted EBITDA: Depreciation and amortization expense 213 113 204 561 333 Loss (gain) from changes in fair value of commodity and FX derivatives, net 142 (6 ) (56 ) (41 ) 96 Total non-cash compensation expense 31 22 31 87 55 Impairment expense and loss on disposal of assets 1 8 4 7 8 Legal settlement expense — 7 — — 7 Consolidated Adjusted EBITDA $ 694 $ 569 $ 615 $ 1,959 $ 2,007
Note: Totals may not sum due to rounding.
Consolidated Adjusted EBITDA and Distributable Cash Flow The following table reconciles our actual Consolidated Adjusted EBITDA and Distributable Cash Flow to Net income attributable to common stockholders for the three months ended September 30, 2019 and 2018, the nine months ended September 30, 2019, and forecast amounts for full year 2019 and full year 2020 (in billions): Three Months Nine Months Ended Ended September 30, September 30, Full Year Full Year 2019 2018 2019 2019 2020 Net income (loss) attributable to common stockholders $ (0.32 ) $ 0.07 $ (0.29 ) $ (0.2 ) - $ 0.0 $ 0.3
Net income attributable to non-controlling interest 0.06 0.16 0.37 0.5
0.7
Income tax provision (benefit) (0.00 ) 0.00 0.00 0.0 0.2 Interest expense, net of capitalized interest 0.40 0.22 1.01 1.5 1.6 Depreciation and amortization expense 0.21 0.11 0.56 0.8 0.9 Other expense, financing costs, and certain non-cash operating expenses 0.35 0.01 0.31 0.3
0.1 Consolidated Adjusted EBITDA $ 0.69 $ 0.57 $ 1.96 $ 2.9
$ 3.8
Distributions to CQP non-controlling interest (0.15 ) (0.14 ) (0.45 ) (0.6 ) (0.6 ) SPL and CQP cash retained and interest expense (0.23 ) (0.31 ) (0.83 ) (1.5 ) (1.6 ) Cheniere interest expense, income tax and other (0.11 ) (0.01 ) (0.17 ) (0.3 ) (0.6 ) Cheniere Distributable Cash Flow $ 0.20 $ 0.11 $ 0.52 $ 0.6
$ 1.0
Vice President, Investor Relations – (713) 375-5479, randy.bhatia@cheniere.com
Director, Investor Relations – (713) 375-5492, megan.light@cheniere.com