
SLIDE 1
Chapter 11
Nutrient Cycling and Tropical Soils
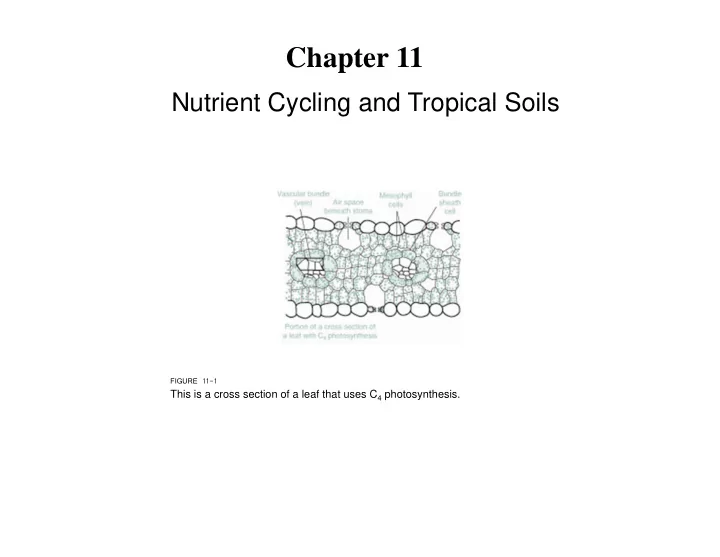
FIGURE 11-1 This is a cross section of a leaf that uses C4 photosynthesis.
Chapter 11 Nutrient Cycling and Tropical Soils FIGURE 11-1 This is - - PowerPoint PPT Presentation
Chapter 11 Nutrient Cycling and Tropical Soils FIGURE 11-1 This is a cross section of a leaf that uses C 4 photosynthesis. (a) (b) PLATE 11-1 Cactus such as this tree-sized Opuntia from the Galpagos Islands (a) and Old World euphorbias (b)
FIGURE 11-1 This is a cross section of a leaf that uses C4 photosynthesis.
PLATE 11-1 Cactus such as this tree-sized Opuntia from the Galápagos Islands (a) and Old World euphorbias (b) are examples of convergent evolution. (a) (b)
PLATE 11-2 Large and diverse mammals, the megafauna, still characterize the African savanna. PLATE 11-3 This baobab grows on Madagascar, but it is very similar to those that grow throughout African savannas.
PLATE 11-4 Caribbean pine grows extensively in savannas throughout much of Central America and the West Indian islands. This stand is part of the savanna ecosystem on Abaco Island in the Bahamas. PLATE 11-5 Spinifex grasses characterize dry forest in much of Australia. PLATE 11-6 The wallaby (with a “joey” in her pouch) is
Australia today, but many larger species from the Pleistocene are now extinct.
FIGURE 11-2 Average annual rainfall, calculated over the entire KNP and in the nutrient-rich versus nutrient-poor landscapes, plotted for the study period. Annual rainfall, calculated for the whole KNP, was 623 6 124 millimeters (mean 6 SD) in the six wettest years (1981, 1985, 1988, 1990, 1991, 1993) and 361 6 86 millimeters in the six driest years (1982, 1983, 1986, 1987, 1989, 1992).
PLATE 11-7 Savanna is the dominant ecosystem of the Northern Territory of Australia.
PLATE 11-8 African buffalo are among the more formidable herbivores on the savanna. Even lions are wary of attacking them. PLATE 11-9 The African lion is the top carnivore of the savanna ecosystem.
PLATE 11-10 THOMSON’S GAZELLE FIGURE 11-4 Grazing and digestion constraints as generated by the forage maturation model. Maximum energy intake occurs at the junction of the two constraints at a sward biomass of 25 grams per square meter. FIGURE 11-3 Digestibility of leaf and sheath tissue for Thomson’s gazelles as a function of the biomass of leaf and sheath in the sward.
FIGURE 11-5 Sequential census (taken once every two weeks) of spatial distribution of Thomson’s gazelles within a 40- 3 40-kilometer grid centered on the northwestern Serengeti Plain (coordinates of northwestern corner: 2832.19S, 348579E). Shading corresponds to gazelle density, with the darkest shade being closest to 0 and the lightest shade closest to 300 animals per square kilometer. FIGURE 11-6 Relative gazelle 3 tness due to food or energy intake (over the grass biomass range 0 to 100 grams per square meter) predicted by the four foraging models and the null model. Relative ecological 3 tness was estimated by dividing intake at a given grass biomass by intake summed over the full range (10 to 100 g/m2).
FIGURE 11-7 Heavily browsed A. nigrescens tree canopies showing different shapes due to the impact of different ungulate browsers. Note the clear height of giraffes’ browsing limit in the tree in panel (b). PLATE 11-11 Giraffes are among the browsers of the African savanna. (a) (b)
PLATE 11-12 Wildebeest are among the large, hoofed mammals that have a complex annual migration on the Serengeti. FIGURE 11-8 The Serengeti Mara ecosystem includes parts of northern Tanzania and southwestern Kenya (see insets). Areas include Serengeti National Park (SNP), Ngorongoro Conservation Area (NCA), Maswa Game Reserve (MGR), Masai Mara National Reserve (MMNR), Grumeti Game Reserve (GGR), Ikorongo Game Reserve (IGR), and Loliondo Conrolled Area (LCA). Wildebeest are in the northern portion of the ecosystem in the dry season, in the Western Corridor in transitional periods of some years, and in the southern part of the ecosystem in the wet season.
FIGURE 11-9 Pathways from (a) 3 ve VHF-tracked wildebeest, (b) 3 ve GPS- tracked wildebeest, and (c) 3 ve simulated wildebeest. Lines connect successive observations of tracked animals that are typically more than one day apart and do not indicate direct travel between points. FIGURE 11-10 Comparison of (a) wildebeest and (b) Thomson’s gazelle percent- age of births over the course of a year. Dotted line is the percent crude protein of grass. PLATE 11-13 Impala typically alternate from grazing to browsing. (a) (b)
PLATE 11-14 Wildebeest cow giving birth on the Serengeti. Note the legs of the baby dangling from the mother. PLATE 11-15 Wildebeest calves are precocial, able to run and keep up with the herd soon after birth.
PLATE 11-16 Black vulture at armadillo carcass. PLATE 11-17 Like other vultures, turkey vultures soar on thermal air currents as heat radiates from the ground to the air. This is how the birds search for prey. PLATE 11-18 Lappet-faced vulture, the largest of the Serengeti vultures. PLATE 11-20 Vultures massing at a carcass, many with blood-covered necks. PLATE 11-19 Rüppell’s griffon, a long-necked vulture, at a carcass with other
blood.
FIGURE 11-11 Relationship between Jaccard’s index (a measure of similarity among plant communities, in this case grazed versus ungrazed) in relation to annual
similarity between the grazed and ungrazed
study. FIGURE 11-12 Abundance of olive hissing snakes (P. mossambicus) on plots with and without large herbivores.
FIGURE 11-13 Schematic model guiding structural equation modeling (SEM) analyses. The boxes represent major conceptual categories of variables; the arrows represent the relationships and the directions of those relationships that were examined in SEM analyses. PLATE 11-21 Lion pride among acacias on the Serengeti.
FIGURE 11-14 The relationship between tree and dung density for all (a) wild herbivores, (b) giraffes, and (c) elephants. PLATE 11-22 Giraffes, though browsers, are usually found in open areas with relatively few trees. PLATE 11-23 Elephants have little or no aversion to being within areas of high tree density.
FIGURE 11-15 (a) Proportion of seedlings depredated, (b) proportion of seedlings desiccated, and (c) total proportion of seedlings surviving as a function of plot treatment and caged/uncaged status. Error bars represent 61 SE.
PLATE 11-24 (a) Elephant-damaged Acacia mellifera with multiple damaged stems. (b) Close-up of recent elephant damage illustrating crevices, with a pencil for scale. (c) Arti3 cial “elephant damage” created for lizard transplant experiment, with pencil for
FIGURE 11-16 Positive feedback mechanism between grass biomass (fuel load) and 3 re intensity, triggered by (a) grazing and (b)
to trees, consequently resulting in an increase in woody vegetation.
PLATE 11-25 Representative trees from the study: these two Acacia drepanolobium trees had the same height (1.4 meters) and similar basal diameters (grass- removal tree, 2.9 centimeters; control tree, 3.4 centimeters) when the experiment began in 2005. After two years, the grass-removal tree (right) had increased in height by 0.3 meter, whereas the control tree (left) had increased in height by only 0.07 meter. FIGURE 11-17 Growth of Acacia drepanolobium trees (mean 6 SE) over two years with and without the subcanopy grass removed. Growth is measured as (a) change in height and (b) change in stem diameter.
PLATE 11-26 Zebras were unaffected by rinderpest.
FIGURE 11-18 Observed densities of herd presences compared with distance to water. Note the differences between nutrient-rich and nutrient-poor landscapes in wet and dry years.
PLATE 11-27 Pine savanna in southern Belize.
PLATE 11-28 Large 3 ocks of birds mass on the Llanos, including spoonbills, egrets, and ibis, shown here. PLATE 11-29 Capybara with young, abundant on the Llanos.
PLATE 11-30 Large numbers of wading birds frequent Pantanal marshes.
PLATE 11-31 Jabirou nest on the Pantanal.
PLATE 11-32 RED-LEGGED SERIEMA PLATE 11-33 SECRETARYBIRD
PLATE 11-34 Thornwoods are common in more arid areas in the Neotropics. PLATE 11-35 COMMON RHEA