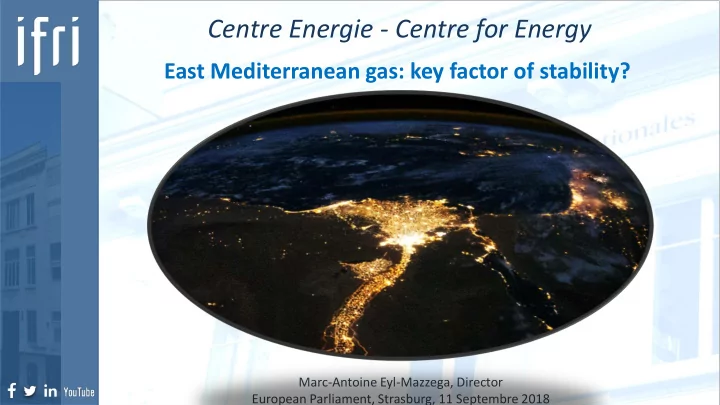

Centre Energie - Centre for Energy East Mediterranean gas: key factor of stability? Marc-Antoine Eyl-Mazzega, Director European Parliament, Strasburg, 11 Septembre 2018
Egypt’s population is booming, so is electricity demand, fueling energy insecurity in past years Evolution of Egypt’s population, 1990-2050e Total Electricity Consumption (TWh) & GDP ($Bn) 180 000 250 350 160 000 300 200 140 000 250 120 000 150 100 000 200 $billion TWh 80 000 150 100 60 000 100 40 000 50 20 000 50 0 0 0 1990 1993 1996 1999 2002 2005 2008 2011 2014 2017 2020 2023 2026 2029 2032 2035 2038 2041 2044 2047 2050 Total population (Thousands) Total electricity consumption GDP Bn $ 2 Source: UN. World Population Prospects 2017 Source: IEA, World Bank
Booming urban population: challenge of sustainable cities Population in 2015, 2025 and 2035e (in million) 3 Source: UN World Urbanization Prospects 2018
Egypt’s CO2 emissions rising… Carbon Dioxide Emissions, 2007-2017 (Mt) 250 200 150 100 50 0 2007 2008 2009 2010 2011 2012 2013 2014 2015 2016 2017 Carbon dioxide emissions (Mt) 4 BP Statistical Review June 2018
Energy mix dominated by oil and gas, based on domestic resources and some imports Egypt’s energy mix (Mtoe), 2017 Hydro Renewables 3% 1% Oil 43% Gas 53% BP Statistical Review june 2018 5
Egypt suffered from the decline in domestic oil and gas production Egypt’s gas production and consumption trends, Comparison of Egypt’s and emerging 2007-2017 (Bcm) economies GDP growth (%), 2007-2017 70 10 9 60 8 50 7 6 40 5 30 4 3 20 2 10 1 0 0 2007 2008 2009 2010 2011 2012 2013 2014 2015 2016 2017 2007 2008 2009 2010 2011 2012 2013 2014 2015 2016 2017 Egypt Average low&middle income economies Gas production Gas consumption 6 Source: World Bank Source: BP Statistical Review June 2018
Gas-dominated electricity mix key challenge as Egypt became net importer of gas Egypt’s Electricity Mix (TWh), 2017 Split of natural gas consumption by sector, 2016 Hydro Renewables Oil 7% 1% 14% Residential 4% Chemical/Petro chemical Transport 11% 1% Industry 12% Power Sector Energy industry 62% own use 10% Gas BP Statistical 78% Review june Egypt’s power sector consumed 33 bcm in 2017, similar to Italy’s power sector 2018 7
Egypt undergoing painful but necessary economic reforms, including progressive removal of energy subsidies Egypt’s budget sector* expenditure (in % of GDP) 35 30 25 20 15 10 5 0 2015/2016 2016-2017 2017/2018 2018/2019 2019/2020 2020/2021 2021/2022 2022/2023 Total Expenditure Energy Subsidies Fuel Subsidies 8 Source: IMF Country Report No. 18/213 *Budget sector comprises central government, local governments, and public corporations Fuel subsidies: gasoline, diesel, kerosene, LPG and fuel oil;
Gas output could nearly double following key ENI and BP projects, LNG imports will stop, providing economic relief Egypt’s gas supplies (excluding pipeline imports), 2014-2021e (bcm) 90 80 70 60 50 40 30 20 10 0 2014 2015 2016 2017 2018 2019 2020 2021 Atoll, Nooros and near term developments LNG FSRU Zohr WND - North Alexandria WND - Phase 2 Salamat ENI’s possible Noor discovery, if confirmed, would be another 9 game changer for Egypt and the region Source: Ifri, BP, ENI, Gafney Cline& Associates
Egypt working to add coal, nuclear & renewables capacities, gas demand for power & industry continues to grow Gas demand/supply balance, 2007-2022 E (bcm) Electricity Mix « Updated Optimal Scenario » 2029/2030 (%) 90 80 11 70 26 9 60 50 40 16 10 30 4 20 24 10 0 2007 2008 2009 2010 2011 2012 2013 2014 2015 2016 2017 2018 2019 2020 2021 2022 CSP PV Wind Hydro Gas&Oil Nuclear Coal Gas consumption Gas production Source: Ministry of Electricity and Renewable Energy Source: BP2018, Ifri estimates Inefficient thermal plants could be phased out and the 14,4 GW Siemens turbines are super efficient, however gas demand will still grow as gas fired plants will offer a back up to meet peak demand, will offset oil plants and will provide a reserve to compensate for potential 10 delays in the development of other projects. This will constain the gas export potential.
Israel another gas winner: electricity mix cleaner&more secure, surpluses exported to Jordan and Egypt Israel’s electricity mix in 2010 and 2016 Source: Ifri Israel will phase out coal by 2030 and gas will meet growing domestic demand for power and in 11 the transport sector. A second export wave > 2025 is possible… if Leviathan phase 2 is developed
Egypt will become a gas hub in the Eastern Mediterranean as infrastructure is already in place East Mediterranean gas infrastructure and projects Offshore gas projects are not cheap, Egypt is a growing&attractive market, sunk cost infrastructure or small new investments likely to be privilegged for selling gas. LNG exports from 12 Egypt based on Israeli or Egyptian gas to Europe likely though in the short term. Source: Ifri
Cyprus’ gas potential promising, exploration ongoing (Calypso…), synergies with Israeli/Egyptian infrastructure… Source: Ihutterstock 13
Centre Énergie – Centre for Energy eylmazzega@ifri.org 27, rue de la Procession, 75740 PARIS CEDEX 15 Tél. +33 (0) 1 40 61 60 00 • Fax : +33 (0) 1 40 61 60 60 www.ifri.org 14
Recommend
More recommend