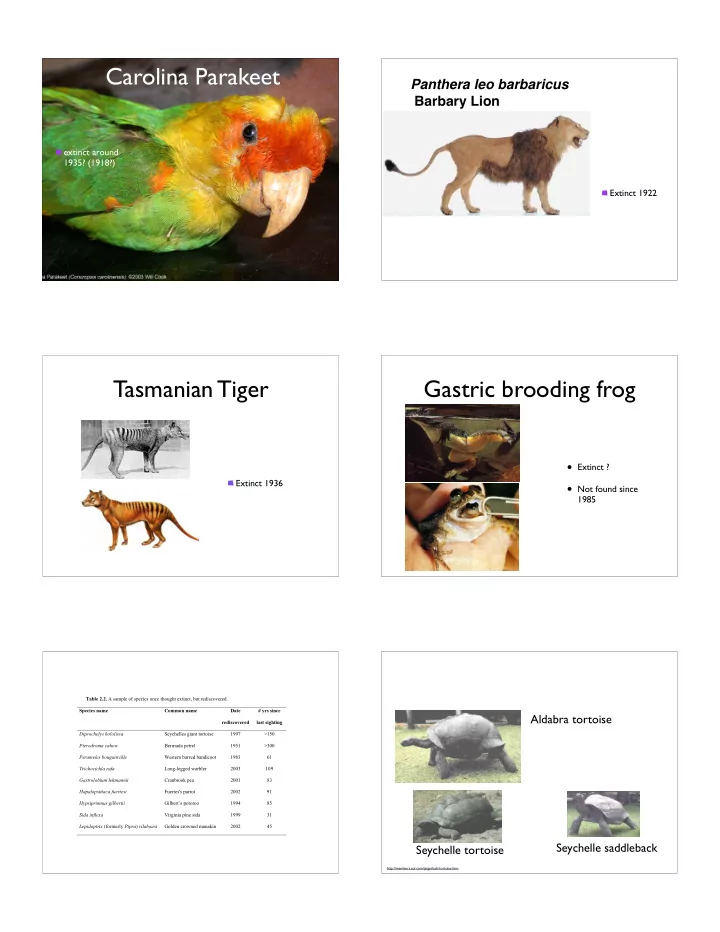
Carolina Parakeet Panthera leo barbaricus Barbary Lion extinct - - PDF document

carolina parakeet
SMART_READER_LITE
LIVE PREVIEW

Carolina Parakeet Panthera leo barbaricus Barbary Lion extinct - - PDF document

Carolina Parakeet Panthera leo barbaricus Barbary Lion extinct around 1935? (1918?) Extinct 1922 Tasmanian Tiger Gastric brooding frog Extinct ? Extinct 1936 Not found since 1985 Table 2.2. A sample of species once thought extinct,


slide-1
SLIDE 1

Carolina Parakeet

extinct around 1935? (1918?)

Panthera leo barbaricus Barbary Lion

Extinct 1922

Tasmanian Tiger

Extinct 1936

Gastric brooding frog

  • Extinct ?
  • Not found since

1985

Table 2.2. A sample of species once thought extinct, but rediscovered. Species name Common name Date rediscovered # yrs since last sighting Dipsochelys hololissa Seychelles giant tortoise 1997 >150 Pterodroma cahow Bermuda petrel 1951 >300 Perameles bougainville Western barred bandicoot 1983 61 Trichocichla rufa Long-legged warbler 2003 109 Gastrolobium lehmannii Cranbrook pea 2001 83 Hapalopsittaca fuertesi Fuertes's parrot 2002 91 Hypsiprimnus gilbertii Gilbert’s potoroo 1994 85 Sida inflexa Virginia pine sida 1999 31 Lepidoptrix (formerly Pipra) vilaboasi Golden crowned manakin 2002 45

Aldabra tortoise Seychelle saddleback Seychelle tortoise

http://members.aol.com/jstgerlach/tortoise.htm

slide-2
SLIDE 2
  • ng the

Measuring Current Extinctions

Direct observation are difficult Indirect observation: species - area relationship

Species-Area relationship

Number

  • f species S

Area A

S = c × Az

c is a taxon specific constant z is the extinction coefficient is in the range 0.1 to 0.3

Species-Area relationship

log(Number

  • f species S)

log(Area A)

S = c × Az

c is a taxon specific constant z is estimated using the slope Mac Arthur and Wilson (1967): the theory of island biogeography

Fig 4.5 Small mammals in forest granivores all small mammals r2 = proportion of variation explained

slide-3
SLIDE 3

Estimating extinction rates

Snow Soriginal = cAz

now

cAz

  • riginal

Log(Number

  • f species S)

Log(Area A)

Estimating how many species go extinct

Log(Number

  • f species S)

Log(Area A)

Snow Soriginal = Az

now

Az

  • riginal

using z=.15 (this is arbitrary) deforestation = 1.8% per year (Anow / Aoriginal = 98.2/100) 10 million species (Soriginal) Snow = 9,973,000 Difference between Snow and Soriginal = 27,000 species per year

Snow = Soriginal Az

now

Az

  • riginal

Causes of extinction?

Causes of endangerment

88 46 20 14 2 10 20 30 40 50 60 70 80 90 100

Habitat destruction and degradation Exotic species Pollution Overharvest Disease Percent of species affected

Causes of endangerment

88 46 20 14 2 10 20 30 40 50 60 70 80 90 100

Habitat destruction and degradation Exotic species Pollution Overharvest Disease Percent of species affected

Causes of extinction

Habitat destruction habitat loss (less area = fewer species)

slide-4
SLIDE 4

Fringed prairie orchid

Causes of extinction

Habitat destruction habitat loss (less area = fewer species) habitat fragmentation

Fig 55.6 Forest cover of Cadiz Township in Wisconsin

Causes of extinction

Habitat destruction habitat loss (less area = fewer species) habitat fragmentation Edge effects

Fragmentation

Fig 4.5 Small mammals in forest granivores all small mammals r2 = proportion of variation explained

slide-5
SLIDE 5

Causes of extinction

Habitat destruction Habitat loss (less area = fewer species) Habitat fragmentation Edge effects Isolation

Causes of endangerment

88 46 20 14 2 10 20 30 40 50 60 70 80 90 100

Habitat destruction and degradation Exotic species Pollution Overharvest Disease Percent of species affected

Exotic species

Exotic species: species introduced to regions outside of their native range Invasive species: an exotic species with strongly increasing populations (and most often detrimental effect on the native species or habitats)

Exotic species Invasive species

Introduced to Guam, predated and eradicated all native endemic bird species Introduced to the South- East USA for their edible leaves and pretty flowers. Overgrowing forests, changing native habitats Introduced through boats into Great Lakes, clogging up water intakes, removing food more effective out of water column than natives.

Brown tree snake Kudzu Zebra mussel

slide-6
SLIDE 6

Causes of endangerment

88 46 20 14 2 10 20 30 40 50 60 70 80 90 100

Habitat destruction and degradation Exotic species Pollution Overharvest Disease Percent of species affected

Pollution

Point sources Non-Point sources

Pollution

Air Global warming Acid rain Ozone depletion, smog, .... Water

Pollution Heavy metal

Water Body Species Women of childbearing age, young children All Other Individuals (# of meals)* Lake Iamonia Largemouth Bass One per month One per week Lake Jackson Black Crappie, Bluegill, Largemouth Bass One per month One per week Lake Miccosukee Bluegill Largemouth Bass Two per week One per month Two per week One per week Lake Munson Black Crappie, Redear Sunfish One per month One per week Moore Lake Largemouth Bass One per month One per week

http://www.myfloridaeh.com/community/fishconsumptionadvisories/FWFGuide.htm

Water Toxins Nutrients eutrophic vs oligotrophic

Pollution

PRESS RELEASE, JULY 26, 2004 LOUISIANA UNIVERSITIES MARINE CONSORTIUM AVERAGE SIZE "DEAD ZONE" IN ANYTHING BUT AN AVERAGE YEAR The coast-wide extent of the Louisiana "dead zone" mapped this week is slightly larger than average at 15,040 km2 (5,800 square miles). The long-term average since mapping began in 1985 is 13,000 km2 (5,000 square miles). The river flow and the offshore conditions prior to the mapping cruise were anything but normal and were more reminiscent of the Great Mississippi River Flood of 1993. The river in 2004 peaked in discharge several times in January February, March and May, followed by a prolonged above average flow that persisted from June into July, as in 1993.

slide-7
SLIDE 7

Exploitation

Commercial Recreational

Incidental Exploitation

Bycatch: albatross, whales, .... Predator control in parks Recreation Pets

Diseases

(Atelopus zeteki) www.clemetzoo.com/conservation/project_golden_frog.asp

Chytrid, a fungus, is believed to be one of the sources for amphibian decline

Causes of extinction

Habitat destruction Exotic species Pollution Exploitation Diseases