SLIDE 1
OVERALL PERFORMANCE
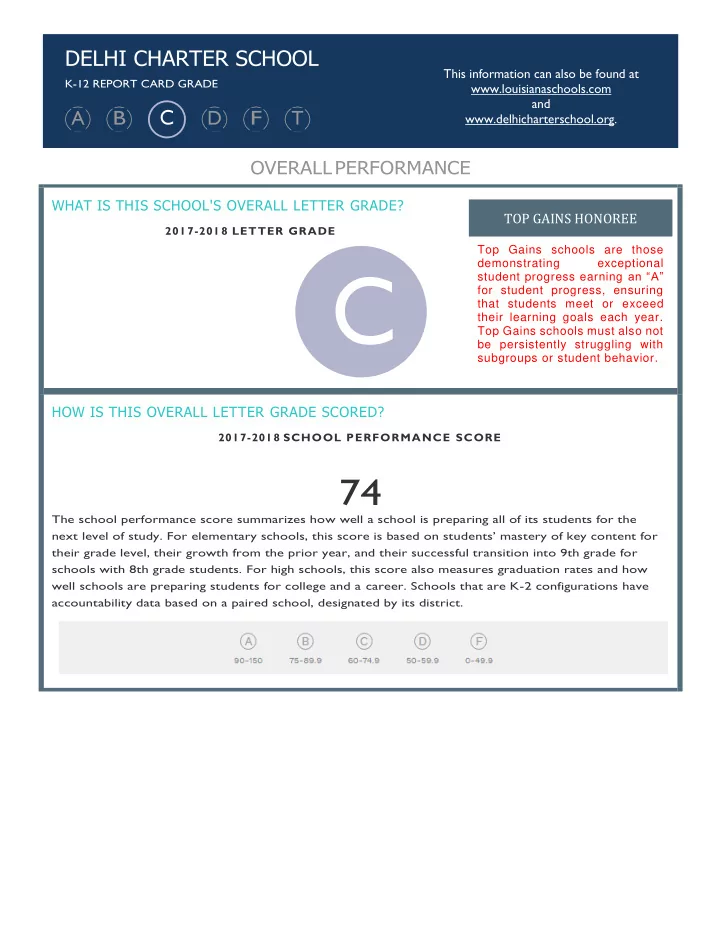
WHAT IS THIS SCHOOL'S OVERALL LETTER GRADE?
201 7-201 8 LETTER GRADE
C
HOW IS THIS OVERALL LETTER GRADE SCORED?
201 7-201 8 SCHOOL PERFORMANCE SCORE
74
The school performance score summarizes how well a school is preparing all of its students for the next level of study. For elementary schools, this score is based on students’ mastery of key content for their grade level, their growth from the prior year, and their successful transition into 9th grade for schools with 8th grade students. For high schools, this score also measures graduation rates and how well schools are preparing students for college and a career. Schools that are K-2 configurations have accountability data based on a paired school, designated by its district.
A
TOP GAINS HONOREE
Top Gains schools are those demonstrating exceptional student progress earning an “A” for student progress, ensuring that students meet or exceed their learning goals each year. Top Gains schools must also not be persistently struggling with subgroups or student behavior.
This information can also be found at www.louisianaschools.com and www.delhicharterschool.org.
SLIDE 2 HOW HAS THIS SCHOOL PERFORMED OVER TIME?
201 7-201 8 OVERALL PERFORMANCE ( NEW FORMULA)
C
74
201 7-201 8 OVERALL PERFORMANCE (OLD FORMULA) B
86.6
201 6
7 OVERALL PERFORMANCE (OLD FORMULA) B
92.9
HOW DOES THIS SCHOOL'S SCORE COMPARE TO ITS SCHOOL SYSTEM'S SCORE?
201 7-201 8 OVERALL SCHOOL PERFORMANCE
C
74
201 7-201 8 OVERALL SCHOOL SYSTEM PERFORMANCE
Not Applicable
HOW IS THIS SCHOOL PERFORMING ON PERFORMANCE SCORE METRICS?
This year's school performance scores reflect two new changes. 1) The bar for “A” schools has been raised. Schools receive less points for students performing at the “Basic” level, and more points for students performing at advanced levels; 2) 25 percent of a school's rating (12.5% for high schools) comes from the new “Student Progress” index measuring how well students are progressing towards “Mastery” throughout the school year, regardless of where they started. This measure values the individual progress of every student, and not just their performance at the end of the year.
SLIDE 3
STUDENT PERFORMANCE
WHAT IS STUDENT PERFORMANCE? FOR ELEMENTARY/ MIDDLE SCHOOL
Student performance is based on students’ mastery of key content for their grade level; if the school has 8th grade students, it also includes information on students’ successful transition into 9th grade.
FOR HIGH SCHOOL
Student performance is based on how well students are mastering key skills and content for their grade, in addition to how well the school is preparing students for success in college or a career.
HOW IS THIS SCHOOL DOING ON STUDENT PERFORMANCE?
ASSESSMENTS
D
55.1
ACT
C
68.1
GRADUATION
A
92.6
STRENGTH OF DIPLOMA
A
92.6
Mastery and above on the LEAP assessments indicate student proficiency of grade-level content and true readiness for the next level of study. This indicator measures how well schools are preparing 8th graders for success in high school by the number of Carnegie credits they earn by the end of 9th grade. Students who earn at least six credits are considered on track to graduate in four years. This indicator measures the percentage of students earning a 21 or higher on the ACT or a Gold WorkKeys Certificate or higher indicating students’ readiness for college or the workforce.
SLIDE 4 IS THIS SCHOOL PREPARING HIGH SCHOOL STUDENTS FOR COLLEGE AND CAREER??
This indicator measures the percentage of students graduating within four years with a high school diploma. This indicator lags one year so the year that is reported equates to the previous year’s graduating class. For example, a "16-17" graduation rate measures the rate for the class of 2016.
This indicator measures the percentage of the cohort who completed college-level coursework or attained proficiency with an industry-valued skill set recognized by the Workforce Investment Council (WIC).
This indicator measures the rate at which students enrolled in college by the 1st fall semester after graduating from high school.
This indicator measures the rate at which students are submitting the FAFSA for financial aid for post-secondary education, a requirement for all graduating seniors.
SLIDE 5 STUDENT PROGRESS
WHAT IS STUDENT PROGRESS?
Student progress measures the rate at which students are progressing towards mastering the key skills they need to be successful in the next grade level. This rating recognizes the growth students achieve throughout the school year, rather than just recognizing their performance on end-
HOW WELL ARE STUDENTS PROGRESSING?
201 7-201 8 PROGRESS RATING
A
201 7-201 8 PROGRESS SCORE
91
HOW IS THIS SCHOOL PERFORMING ON EACH COMPONENT OF THE STUDENT PROGRESS SCORE?
STUDENTS DEMONSTRATING TOP GROWTH ( HIGH SCHOOL)
56%
STUDENTS DEMONSTRATING TOP GROWTH ( ELEMENTARY/ MIDDLE SCHOOL)
46%
This indicator measures the percent of students who are on track to achieve Mastery or Advanced by 10th grade or outperform similar statewide peers on ELA and/or math assessments. This indicator measures the percent of students who are on track to achieve Mastery or Advanced by 8th grade or outperform similar statewide peers on ELA and/or math assessments.
SLIDE 6
BREAKDOWN BY STUDENT GROUPS
WHAT IS THE BREAKDOWN BY STUDENT GROUPS
The breakdown by student groups provides information on how well a school is serving all of its students, as well as the demographic makeup of the school.
HOW IS THIS SCHOOL PREPARING SPECIFIC GROUPS OF STUDENTS FOR THE NEXT LEVEL OF STUDY?
This is how percentiles are calculated 50 100 (Lowest Performing) (Average Performing) (Highest Performing)
ECONOMICALLY DISADVANTAGED WHITE
50 50 For this group, the school performed better than For this group, the school performed better than
52% of all Louisiana schools. 40% of all Louisiana schools.
HOW IS THIS SCHOOL PERFORMING IN PREPARING STUDENTS OF COLOR?
This is how percentiles are calculated 50 100 (Lowest Performing) (Average Performing) (Highest Performing)
AFRICAN AMERICAN
50 For this group, the school performed better than
62% of all Louisiana
schools.
SLIDE 7
HOW DIVERSE IS THIS SCHOOL'S STUDENT POPULATION?
SLIDE 8
TEACHER W ORKFORCE
WHAT IS TEACHER WORKFORCE?
Teacher workforce provides information on the school’s teacher workforce, including teacher qualifications, teacher diversity, and the extent to which teachers choose to continue teaching at the school year to year.
HOW STRONG IS THE TEACHER WORKFORCE IN THIS SCHOOL? HOW DIVERSE IS THIS SCHOOL'S TEACHER WORKFORCE?
SLIDE 9
DISCIPLINE & ATTENDANCE
WHAT IS DISCIPLINE AND ATTENDANCE?
Discipline and Attendance provide information on how well this school is ensuring that students are in classrooms and learning daily.
HOW IS THIS SCHOOL ENSURING THAT STUDENTS ARE IN THE CLASSROOM AND LEARNING DAILY?
STUDENTS MISSING FEWER THAN 1 5 DAYS OF SCHOOL
87%
STUDENTS WITH ZERO OUT- OF-SCHOOL SUSPENSIONS
97%
Students who miss 15 or more school days (approximately 10% of the school year) for any reason are considered chronically absent. Research shows that chronic absenteeism is associated with a number of negative consequences for students, including lower achievement, disengagement from school, course failure, and increased risk of dropping out.