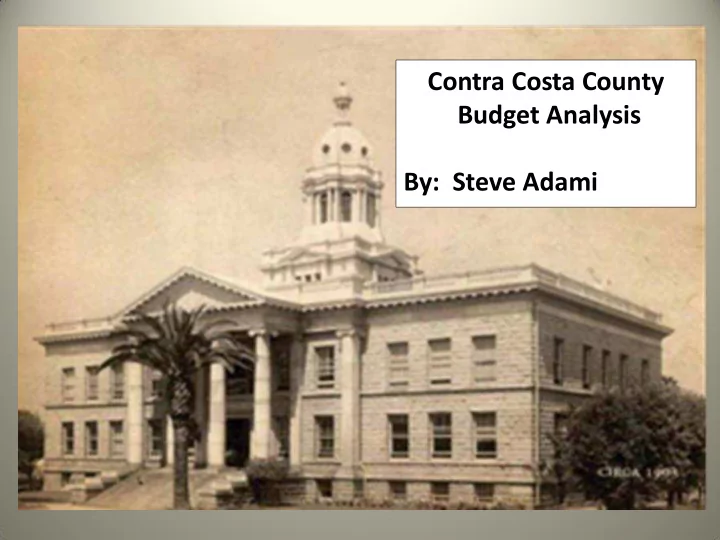

Contra Costa County Budget Analysis By: Steve Adami
• Population: 1, 049, 025 • 4 th wealthiest county in California (median household income) • 5 th in California per capita income
Mission: Contra Costa County is dedicated to providing public services which improve the quality of life of our residents and the economic viability of our businesses
Contra Costa County
Budget Format • Baseline Budgeting • Baseline is determined by Director of Finance based on projections of General Purpose Revenue • Prepared by – FUND – FUNCTION (Public Protection) – DEPARTMENT (Sheriff) – OBJECT LEVEL (Salary and Ben.) • Quasi-performance budget • FY 14 perform indicators and metrics added
January February September July 1st May Required to adopt a budget by March May 31st April
Total General Fund Revenue by Fiscal Year $1,420,000,000 $1,401,701,155 $1,400,000,000 $1,380,000,000 $1,380,770,704 $1,353,015,047 $1,360,000,000 $1,340,000,000 $1,341,346,490 $1,320,000,000 Revenue decreased by $1,330,257,227 $50 million (4%) over 5 years $1,300,000,000 $1,280,000,000 2007 2008 2009 2010 2011
Percent Share Revenue Misc Rev Other Financing 1% Services FY 2011 0.015% Charges for Other Taxes Property taxes 1.5% Current Services 21% 20% Licenses Permits Other Aid & Franchises 1.7% 2% Fines, Forfeitures, & Penalties 2% Federal Aid 18.5% State Aid 32% Rev from Use of Money & Property 0.4%
Revenue Changes from FY 2007 to FY 2011 40% 28% 20% 12% 7% 5% 0% -5% -20% -24% -34% -40% -37% -60% -59% -80% -84% -100% -99% -120%
Share Analysis by Revenue Source, FY 2007/2011 35.0% 30.0% 25.0% 20.0% 15.0% 10.0% 5.0% 0.0% Lic,Per, Fines, Rev State Aid Federal Other Charg Prop Tax Othr Tax Misc Rev Othr Fin Fran Forf, Pen Money Aid Aid Serv 2007 21.6% 1.9% 2.7% 1.3% 2.3% 27.6% 16.9% 4.0% 18.0% 2.0% 1.7% 2011 21.2% 1.5% 1.8% 1.8% 0.4% 32.1% 18.4% 1.7% 19.9% 1.3% 0.015%
Total General Fund Expenditure by Fiscal Year 1,360,000,000 $1,339,985,217 1,340,000,000 $71.5 million reduction $1,314,916,076 1,320,000,000 1,300,000,000 $1,310,288,576 1,280,000,000 $1,263,988,874 1,260,000,000 -1% AGR from FY 2007 to 2011 1,240,000,000 $1,243,406,695 Spending decreased by 4% between 1,220,000,000 FY 2007 & FY 2011 (46 million) 1,200,000,000 1,180,000,000 2007 2008 2009 2010 2011
Percent Share of Expenditure Sources in FY 2011, General Fund Debt Service 5% Education 2% General 9% Public Protection Public Assistance 28% 31% Health Public Ways and 18% Facilities 7%
Expenditure Changes from FY 2007 to FY 2011 Public Public Ways Public General Protection and Facilities Health Assistance Education Debt Service 30% 20% 23% 10% 14% 0% 0% -11% -5% -10% -27% -29% -20% -30% -40% General Public Protection Public Ways and Facilities Health Public Assistance Education Debt Service
Spending decreased by 4% between Share Analysis Expenditure Source, FY 2007 and FY 2011 FY 2007 & FY 2011 (46 million) 35.0% 30.9% 29.8% 28.9% 30.0% 28% 2007 25.0% 2011 20.0% 17.8% 13.9% 15.0% 11.2% 9.7% 10.0% 8.5% 7.1% 5.4% 4.5% 5.0% 2% 1.8% 0.0% General Public Public Ways Health Public Education Debt Service Protection and Facilities Assistance
How Did They Manage? 1. Employee Concessions: • Workforce reduced through attrition • Major Cuts in Compensation • Furloughs • Wages • Greater cost of pension share for employee 2. County Wellness Program: ELIMINATED 3. Welcome Home Baby: ELIMINATED **Fire District: Closed 4 stations/2 more at risk this year
FTE vs Personnel Costs Personnel cost rose by 9% between FY 07 and FY 13 A reduction of 174 FTE between FY 07 and FY 2013 Year FTE Personnel Costs 2007 6156 690,367,199 2008 6366 720,293,209 2009 6263 730,910,164 2010 5898 691,433,719 2011 5808 694,791,723 2012 5,789 692,131,993 2013 (approved) 5,982 749,428,932
General Fund Reserve Policy Established in 2005 • Maintain a General Fund Balance equal to 10% of General Fund Revenue • Maintain unreserved balance equal to a minimum of 5% General Fund Revenue • Excess over minimum can be used for one-time uses not to exceed 1% of General Fund revenue Additional Reserves Capital Projects Emergencies
Percent of General Fund Revenue Unreserved/Unassigned Fund Balance 14.0% 13.0% 11.7% 12.0% 11.0% 9.7% 9.6% 10.0% 9.1% 8.8% 8.7% 8.6% 9.0% 8.3% 7.3% 8.0% 6.9% 6.7% 7.0% 6.4% 6.0% 5.5% 5.0% 4.0% FY 2002 FY 2003 FY 2004 FY 2005 FY 2006 FY 2007 FY 2008 FY 2009 FY 2010 FY 2011 FY 2012 FY 2013 Actual Actual Actual Actual Actual Actual Actual Actual Actual Actual Budget Rec
GFOA FY beginning July 1, 2011 FY beginning July 1, 2012
PERFORMANCE MEASUREMENTS FTE’s ADDITIONS/REDUCTIONS
Recommendations Budget: • quantify performance measurements • Link performance data directly to unit goals and objectives • list and detail anticipated operating costs associated with nonrecurring capital investments and infrastructure repair/maintenance. County: • Fund Infrastructure ($270 million in deferred facilities maintenance/Capital renewal) • Build Reserves • Pay down debt (OPEB-increase $51m over next 3 years — 21% increase) • Finalize Union Negotiations • Implement PRO GROWTH POLOCIES • Long term solutions for Fire District
Recommend
More recommend