Building Wealth Through Operating and Developing Major Copper and - - PowerPoint PPT Presentation

building wealth through operating and developing major
SMART_READER_LITE
LIVE PREVIEW

Building Wealth Through Operating and Developing Major Copper and - - PowerPoint PPT Presentation

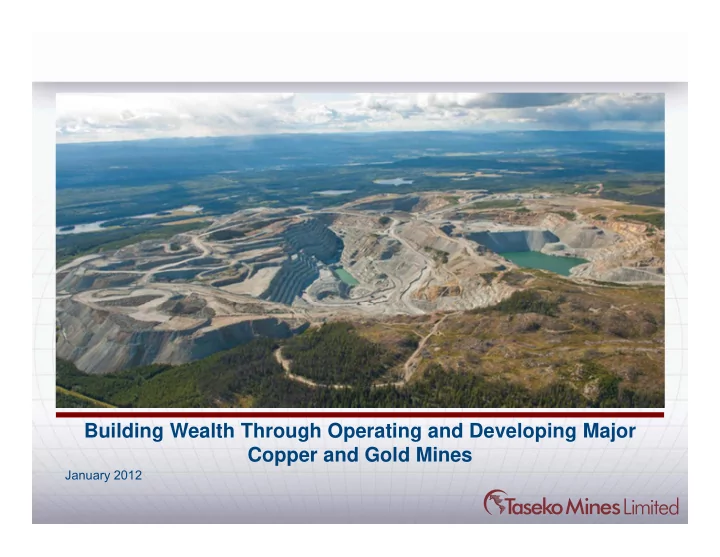
Building Wealth Through Operating and Developing Major Copper and Gold Mines January 2012 Forward-Looking Statements Some of the statements contained in the following material are "forward-looking statements". All statements in this


slide-1
SLIDE 1

January 2012

Building Wealth Through Operating and Developing Major Copper and Gold Mines

slide-2
SLIDE 2

Some of the statements contained in the following material are "forward-looking statements". All statements in this release, other than statements of historical facts, that address estimated mineral resource and reserve quantities, grades and contained metal, and possible future mining, exploration and development activities, are forward-looking statements. Although the Company believes the expectations expressed in such forward-looking statements are based

  • n reasonable assumptions, such statements should not be in any way construed as

guarantees of future performance and actual results or developments may differ materially from those in the forward-looking statements. Factors that could cause actual results to differ materially from those in forward-looking statements include market prices for metals, the conclusions of detailed feasibility and technical analyses, lower than expected grades and quantities of resources, mining rates and recovery rates and the lack of availability of necessary capital, which may not be available to the Company on terms acceptable to it or at

  • all. The Company is subject to the specific risks inherent in the mining business as well as

general economic and business conditions. For more information on the Company, Investors should review the Company's annual Form 40-F filing with the United States Securities Commission at www.sec.gov. and its Canadian securities filings that are available at www.sedar.com.

Forward-Looking Statements

2

slide-3
SLIDE 3

The Taseko Advantage

*Based on 100% of Gibraltar and Prosperity Reserves

Financial Strength Fully Funded Near-Term Mine Expansion Stability

  • Annual copper production capacity to double to 180 million lbs by

2013

  • Annual molybdenum production to triple to 3 million lbs by 2013
  • Three-year payback with 35% IRR
  • ~C$375 million cash and equivalents, 9 months YTD operating profit
  • f $63.6 million
  • Hedged copper revenue at US$3.50/ lb through 2012 for 90% of

production Major Producing Copper Mine Provides Strong Cash Flow

  • Operates in mining friendly jurisdiction in low risk, low taxation

environment in British Columbia

  • Experienced, operations-focused management team

Diversified Project Pipeline

  • Project pipeline of 100% owned, near-term gold, copper and niobium

projects provide strong upside

  • Gibraltar is the second largest open pit copper mine in Canada
  • 2011 production: 82.9 million lbs of copper and 1.3 million lbs of

molybdenum

  • 4.3 billion lbs of recoverable copper and 60 million lbs of molybdenum
  • 27 year mine life

3

slide-4
SLIDE 4

Taseko’s Strong Asset Base…

Gibraltar Mine

  • 4.3 billion lbs

recoverable Cu

  • 60 million lbs

recoverable Mo

  • 75% owned by

Taseko

Harmony

  • 3.0 million oz of

M&I Au resource

Aley

  • 159 million tonnes

Nb2O5 of inferred resource

  • 239 million lbs of

niobium

New Prosperity

  • 3.6 billion lbs

recoverable Cu

  • 7.7 million oz

recoverable Au

British Columbia

Gibraltar

(Copper / Moly)

Prosperity

(Gold / Copper)

Vancouver

Williams Lake

Aley

(Niobium)

Harmony

(Gold)

Mackenzie

4

slide-5
SLIDE 5

...Provides Significant Value

Asset Valuation ($m)

Mineral Assets Gibraltar – After Tax (75%) $1,025 Prosperity – After Tax (100%) $2,008 Aley (100%) $ 270 Harmony (100%) $ 193 Mineral Assets Total $3,496 Financial Assets Cash & Cash Equivalents $ 375 Long-term Debt $ (200) Financial Assets Total $ 175 TOTAL NET ASSET VALUE $3,671 Shares outstanding (millions) 195.50 NAV/ share ($C/share) $ 18.78

Valuation Metric Assumptions: Gibraltar: discount rate of 8%, after GDP3; Forward Cu Curve pulled Sept 23/11, US$14 long term Mo Prosperity: discount rate of 5%; Forward Cu Curve pulled Sept 23/11, US$1,000/ oz Au Aley: US$1.14 kg Nb, in situ value Harmony: US$50/ Au. Oz, in situ value 5

slide-6
SLIDE 6

Location: 65 km north of Williams Lake, British Columbia Ownership: 75% Mineral Reserves: 4.3 billion pounds recoverable copper 60 million pounds recoverable molybdenum

Reserves Update: 802m tons at 0.34% copper equivalent*

Mine Type: Open-pit, 55,000 tpd mill throughput in 2011 85,000 tpd mill throughput in 2013 Mine Life: Extended to 27 years from 12 years in 2004

Increased Production at Gibraltar Driven by Optimization and Continuous Investment

Size (Million Tons) Recoverable Metal Grade Grade

Cu (Billions lbs) Mb (Million lbs) Cu(%) Mo(%) Cu(%) Equivalent*

2011 at 0.20% Cu Cut-off, at $2.25 /lb Cu P&P Reserves

802 4.3 60.0 0.30 0.008 0.34

M&I Resources

950

  • 0.30

0.008 0.34

Reserve/ Resource Update

*Assumed metal prices of: Cu US$2.25/lb; Mb US$16.00/lb; assumed molybdenum recovery relative to copper of 55%.

The resource and reserve estimation was completed by Gibraltar mine staff under the supervision of Scott Jones, P.Eng., Vice President, Engineering and a Qualified Person under National Instrument 43-101. Mr Jones has verified the methods used to determine grade and tonnage in the geological model, reviewed the long range mine plan, and directed the updated economic evaluation. The estimates used long term metal prices of US$2.25lb for copper and US$14.00/lb for molybdenum and a foreign exchange of US$0.85/C$1.00. A technical report will be filed on www.sedar.com

6

slide-7
SLIDE 7

GDP3 to Double Annual Production Capacity by December 2012 to 180 million lbs of Copper…

… and supported by an 80% increase in copper reserves

Multiphase Mine Expansion:

→ ~$1.025 billion NPV (after tax) at 8%* after GDP3 expansion (75% basis)

Phase Project Scope Investment Completion Date Phase I Increased daily production capacity to 46,000 tpd C$76 million 2008 Phase 2 Increased daily production capacity to 55,000 tpd bringing annualized production rates to 115 million lbs

  • f copper and 1.4 million lbs of molybdenum

C$224 million 2011 Phase 3 (GDP3) Construction of a new standalone 55,000 tpd concentrator (Initial run rate = 30,000 tpd) Expansion of mining fleet to provide 85,000 tpd ore delivery; 330,000 tpd mining rate, at life of mine strip ratio Construction of a new molybdenum separation facility to boost molybdenum production to 3 million pounds/ year C$325 million By end 2012

*discount rate of 8%, after GDP3; Forward Cu Curve pulled Sept 23/11, US$14 long term Mo, US$0.05/Cu Eq. lb

7

slide-8
SLIDE 8

Source of Funds:

Use of Funds:

C$M % of total C$M % of total Cash $ 176 54% Concentrator & Moly Plant $ 235 72% Equipment financing $ 90 28% Mining Equipment $ 90 28% JV Partner $ 59 18%

Total $325 100% Total $325 100% Project Financial Highlights:

  • Simple payback of 3 years, based on a C$1.50/lb margin
  • 35% internal rate of return
  • Low capital intensity vs Copper mine projects*
  • $7,800 / tpd mill capacity
  • $10,800 / tpd mill capacity (including mining equipment)

...Is Fully Financed…

8

*Copper Mountain: $14,620/tpd mill capacity; Mount Milligan: $21,600/ tpd mill capacity

slide-9
SLIDE 9

GDP3 Molybdenum Plant Relocated Overland Conveyor Refurbished #2 Primary Crusher Refurbished Coarse Ore Stockpile #2 Concentrator

…And Significantly Expands the Gibraltar Mine

9

slide-10
SLIDE 10

2011 2013 2012 Commissioning Project Engineering Procurement #2 Concentrator Construction Molybdenum Plant Construction Infrastructure Construction

GDP3 is on schedule, on budget and will be commissioned in Q1 2013

10

slide-11
SLIDE 11

…as one of the largest gold-copper porphyries in the world 5-year production profile (based on new Federal Project Description Submission)

→ Life of mine average annual production ~570,000 gold eq. ounces**

Location: 125 km south west of Williams Lake, British Columbia Ownership: 100% Mineral Reserves: 7.7 million ounces recoverable gold 3.6 billion pounds recoverable copper Mine Type: Open-pit, 70,000 tpd mill throughput Mine Life: +20 years

New Prosperity Project Holds Significant Potential…

Yr 1* Yr 2 Yr 3 Yr 4 Yr 5 Average

Gold (ounces) 160,000 300,000 325,000 275,000 305,000 300,000 Copper (thousands, pounds) 75,000 130,000 130,000 120,000 120,000 130,000

* Based on 6 months production ** Based on long-term Au price US $1000/oz, Cu Price US $2.90/lb

11

slide-12
SLIDE 12

The New Prosperity Project ….

12

slide-13
SLIDE 13

Economics

  • Revised Economic Study completed in January 2011
  • Preliminary capital cost estimate of C$1 billion
  • Operating cost of C$8.35 per tonne milled
  • Total costs, net of BPCs at US$2.50 cu, of negative US$125/oz gold

Net Present Value

  • Long term pricing*

$2.00 billion

  • Current spot pricing**

$4.14 billion

…Has Attractive Economics...

13

* Based on: discount rate of 5%; Forward Cu Curve pulled Sept 23/11, US$1,000/ oz Au ** Based on: $4.00 Cu and $1,800 Au

slide-14
SLIDE 14

Regulatory Process is well advanced…

  • British Columbia Government approved project in January 2010
  • Canadian Environmental Assessment Agency (CEAA) announced a Panel Review to

commence in November 2011

  • The Minister of Environment has instructed CEAA to:
  • Design a process which assess the environmental effects identified in the original

project description

  • Ensure information obtained during the original environmental assessment is used
  • Adhere to a timeline of no more than 12 months

→ Expect Environmental Assessment Review to be completed by

November 2012

14

slide-15
SLIDE 15

2010 2011 2012 2013 2014 2015 2016

Commissioning Construction Detailed Facility Engineering & Site Prep Federal EA Certificate New CEAA Review Project Description Complete New Engineering for Project Provincial Mine Permit Process Provincial EA Certificate Granted

…And Supports A Schedule For New Prosperity’s Mine Development

15

slide-16
SLIDE 16

Location: Northern British Columbia Ownership: 100% Mine Type: Open Pit, 5000 tpd mill throughput Mine Life: +20 years

Aley Niobium, A Further Mine Development Opportunity in a $4.5 Billion Industry…

Niobium

  • Specifically used in manufacturing high strength, low alloy steels
  • Green technologies, turbines, aerospace, automobile steels, oil and gas
  • Global annual consumption of ferro-niobium is 210 million lbs / year
  • Growing at 5-7% per year
  • Price has averaged over US $20/ lb in the past four years
  • 3 producers worldwide:
  • CBMM, Brazil
  • Anglo American, Brazil
  • IAMGOLD, Canada

16

slide-17
SLIDE 17

Approximate Outline of Carbonatite Saddle Zone Central Zone

Scale: 2.5 kms Scale: 2.5 kms

…Extensive Drilling has Validated a Known and Economic Mineral Deposit…

17

slide-18
SLIDE 18

Potential Resource/Reserves

Aley Path Forward

→ $18 million approved

expenditures (2011/2012)

  • Build road access
  • Complete major drill program

to convert to M&I 43-101 resource

  • Feasibility study completion

anticipated by Q4 2012 Inferred Resource

  • pen pit, low strip ratio
  • 159 million tonnes at 0.43%

Nb2O5, plus rare earths at 0.20% COG

  • Containing 239 million lbs of

niobium

…And A Feasibility Study is Being Prepared…

18

slide-19
SLIDE 19

Valuation – Niobium Basis Only

  • Recent CBMM transaction values CBMM at $13B
  • Indicates contained Nb value is $1.14/kg based on reserves of 650Mt at 2.5% Nb2O5
  • Based on estimated Niobec NAV of $535M and total resources of 560,000 tonnes

Nb2O5 indicates contained Nb value of $1.35/kg

  • Average value is $1.25/kg contained Nb

… With Significant Potential Value

Inferred Resource In Situ Value Based on Industry Transactions Recovered Metal Value at $50/kg Nb

214m kgs Nb $ 270M $ 10.7B 19

slide-20
SLIDE 20

Location: Haida Gwaii - Graham Island Designated Mineral Development Zone Ownership: 100% Measured & Indicated Resources*: 3 million ounces gold 65 million tonnes @ 1.52 grams Au/tonne Inferred Resources*: 21 million tonnes @ 1.04 grams Au/tonne

Scoping Study, completed in 2007

  • Capital cost of $265 million
  • Operating Cost of $18.50/ tonne milled
  • 10,000 tonnes per day mill throughput
  • 200,000 ounces per year production
  • 12 year mine life

→ $250 million NPV and 22% IRR @ US $900/oz gold**

Harmony Gold Project Offers Additional Growth and Value

20

* 2001 – M. Nowak, P.Eng ** 5% discount rate and 1.00/1.00 US$/C$ exchange rate

slide-21
SLIDE 21

$0 $200 $400 $600 $800 $1,000 $1,200 $1,400 2011 2012 2013 2014 2015 2016

Cu Production Moly Au Production Nb Production Based on US dollars: Cu*: $3.34/ lb $3.35/ lb $3.35/ lb $3.35/ lb $3.33/ lb $3.30/ lb Mo: $14/ lb $14/ lb $14/lb $14/ lb $14/ lb $14/ lb Au: $1000/ oz $1000/ oz Nb: $18/ lb

Copper forecast based on forward curve Gibraltar copper and molybdenum revenue is based on 75% of production

Est ~400% increase in revenue from 2011 - 2016

Current Production, Planned Production Increases, and Project Pipeline Provide Growth and Value Creation…

21

slide-22
SLIDE 22

$0 $200 $400 $600 $800 $1,000 $1,200

2005 2006 2007 2008 2009 2010 2011* Cash and Highly Liquid Investments Total Assets Shareholders' Equity Long Term Debt C$, million

…Supported By Strong Balance Sheet

*As at September 30, 2011 (unaudited) 22

slide-23
SLIDE 23

20 40 60 80 100 120

2008* 2009 2010 2011 9M YTD Operating Profit C$, million

…And Strong Operating Profit

Operating profit= Gross profit - G&A + other operating income – other operating expenses

*15 months 23

slide-24
SLIDE 24

Top 50 Major Global Non-Producing Cu-Au Deposits by Gold Contained

  • Prosperity is one of the largest non-producing copper-gold deposits in a jurisdiction with low

political risk (2nd largest pre-producing deposit in a low political risk jurisdiction globally)

  • 0.2

0.4 0.6 0.8 1.0 1.2 1.4

  • 2

4 6 8 10 12 14 16 18 20 Pebble - Northern Dynasty Minerals Reko Diq - Antofagasta Oyu Tolgoi - Ivanhoe Mines Tampakan - Xstrata Lookout Hill - Ivanhoe Mines Salobo - Vale SA Prosperity - Taseko Mines Bougainville - Rio Tinto Frieda River - Xstrata Agua Rica - Yamana Gold Golpu - Newcrest Mining Galore Creek - NovaGold Resources El Morro - Xstrata Casino - Western Copper Red Chris - Imperial Metals Bystrinskoye - Norilsk Nickel (MMC) Esperanza - Antofagasta Xietongmen - Continental Minerals Telegrafo Sur - Antofagasta Boyongan - Philex Gold Cerro Colorado - Government of Panama Namosi - Newcrest Mining Schaft Creek - Copper Fox Metals Kingking - Benguet Taldybulak Talas - Gold Fields Mirador - Corriente Resources Josemaria - Suramina Resources Mankayan - Bezant Resources Galeno - China Minmetals Ak-Sug - Golevskaya Mining Company El Arco - Southern Copper Cloncurry - Ivanhoe Australia Sinchao - Sinchao Metals Cobre Panama - Inmet Mining Duboashan - China Non-Ferrous Metal Sierra Gorda - Quadra Mining Yandera - Marengo Mining Mirdita - Tirex Resources Kuru Tegerek - China Shen Zhou Mining Tuwu-Yandong - Yunnan Copper Ajax - Abacus Mining and Exploration Ilovitza - EurOmax Resources Taca Taca - Lumina Copper Hushamu - IMA Exploration Gameleira - Vale SA Copper Canyon - SpectrumGold (Novagold) Kodu - Government Of Papua New Guinea Taysan - Chase Resource Tong-La-Shan - Jinshan Gold Mines Nokomis - Duluth Metals Gold Grade (g/t) Total Au Resources (MM ozs)

High Political Risk Medium Political Risk Low Political Risk Gold Grade (g/t)

94M 44M 32M

Source: Wellington West Capital Markets; Metals Economics Group 2008-2009; Fraser Mining Institute Survey for Political Risk; Transparency International Annual Report 2008

Appendix 1: Major Cu-Au Deposits

24

slide-25
SLIDE 25

Appendix 2: Key Accomplishments

Jan 2012

  • 2011 production: 82.9 million lbs of copper and 1.3 million lbs of molybdenum

Nov 2011

  • New Prosperity enters into Federal Environmental Assessment process

Sept 2011

  • Inferred Resource announced at Aley: 158m tonnes at 0.43% Nb2O5 (0.20%

COG) June 2011

  • H1 2011 production: 38.4 million lbs of copper and 619,000 lbs of molybdenum

May 2011

  • Gibraltar’s reserves increase by 80%, to 802m tons
  • Construction of GDP3 Commences, which will increase annual copper capacity by

~60 million lbs to 180 million lbs April 2011

  • Issues Senior Notes for total proceeds of US$200m; due in 2019 and have an

annual interest rate of 7.75%. June 2010

  • BC Provincial Government granted Taseko a long-term mining lease for

Prosperity, providing mineral tenure security May 2010

  • Signed gold stream agreement with Franco-Nevada to sell 22% of future gold

production from Prosperity for US$350 million March 2010

  • Completed transaction to sell 25% Gibraltar Mine for ~$187 million

January 2010

  • Received British Columbia Environmental Assessment Certificate for Prosperity

25

slide-26
SLIDE 26

Share Structure

Appendix 3: Investment Summary

Cash on Hand: ~C$375 million Listed: TSX; TKO / NYSE Amex; TGB Indices: S&P/TSX Composite : S&P/TSX Small Cap S&P/TSX Global Mining : S&P/TSX Global Base Metals Shares Outstanding: 195.5 million Market Capitalization: ~$600 million 52 Week High/Low: C$6.72/C$2.45 ; US$6.62/US$2.30 Analyst Coverage: Scotia Capital, Raymond James, Wellington West, CIBC, Canaccord, Jennings Capital, Paradigm, TD Newcrest, Credit Suisse, Dahlman Rose, MLV Target Range: $4.50- $10.45

26

slide-27
SLIDE 27

Russell Hallbauer, P. Eng - President & CEO and Director – Mr. Hallbauer is a

professional engineer with over 35 years of mining experience. He has a strong background in

  • pen pit and underground mining, overseeing operating joint ventures and revitalizing mines to

profitability.

John McManus, P. Eng - Senior Vice President, Operations – Mr. McManus is a

professional engineer who has worked in the BC mining industry for over 30 years. He has extensive experience in mine operation, mine engineering and environmental management.

Ron Thiessen, CA - Chairman – Mr. Thiessen is an accredited public accountant in Canada.

For over 25 years, he has concentrated on the development of venture capital financing for emerging public and private companies. He is a corporate officer and director of several publicly traded exploration and development companies.

Peter Mitchell, CA - CFO – Mr. Mitchell is an accredited Chartered Accountant in Canada. He

has held leadership finance roles in the mining industry, as well as other industrial companies and more recently, in the for-profit education sector.

Brian Battison - Vice President, Corporate Affairs – Mr. Battison is a public affairs

specialist with over 25 years of experience in policy development, issue management and communication in both the private and public sectors. He has been a senior political and policy advisor in BC and has served as Interim President & CEO of the Mining Association of BC.

Scott Jones, P. Eng - Vice President, Engineering – Mr. Jones has over 25 years of

experience in the mining industry, including property valuations, mining feasibility studies and technical engineering support as well as 10 years in open pit operations and exploration in BC and the Yukon.

Dave Rouleau, P. Eng - Vice President, Operations – Mr. Rouleau has over two

decades of experience in the mining and oil and gas industries. He has extensive experience in mine operations and engineering in British Columbia and Alberta.

Appendix 4: Experienced Management Team

27

slide-28
SLIDE 28

Robert Rotzinger, P. Eng - General Manager, Projects – Robert is a mechanical engineer and has worked at the Gibraltar

Mine since 1994 where he has taken on increasingly senior positions. He has been tasked with the management of diverse engineering, environmental, metallurgical and mining initiatives, such as the revamped molybdenum circuit and Copper Refinery project. He was a key member of the team that restarted operations at Gibraltar last year as well as participating in the development of the Gibraltar Joint Venture with Ledcor CMI Ltd.

Tom Broddy - Manager, Engineering – Tom is a mining engineer with more than 19 years of experience in the mining industry.

Prior to joining Taseko in 2006, he was Manager of Container Operations at Centerm container terminal in the Port of Vancouver. He spent 16 years at Tumbler Ridge working at both the Bullmoose and Quintette coal mines and has significant experience in mine engineering, blasting, pit operations and terminal management.

Greg Yelland, P. Eng – Chief Engineering – Greg is a Mining Engineer with over 30 years experience in the Mining Industry,

primarily in the area of mine engineering and mine operations. He has worked and consulted on projects and operations in South Africa, Zambia, United States and Canada. He has experience in underground gold , chrome and platinum mines as well as open pit copper, cobalt, coal and industrial minerals.

Mary Ellen Thorburn – Corporate Controller – Mary Ellen is a Chartered Accountant, a Certified Public Accountant, and a

Chartered Financial Analyst with more than 18 years of experience in the mining industry. Prior to joining Taseko, she has worked for Barrick Gold Corporation, UBS Securities, and PWC both in Canada and Internationally.

Keith Merriam, P. Eng - Manager, Process Engineering – Keith is a P.Eng. and an Extractive Metallurgist with over 9 years

experience in the Mining Industry, primarily in the area of Mineral Processing. He has worked primarily in technical, commissioning and

  • perational roles, gaining experience in a variety of areas and taking on increasing levels of responsibility. Prior to joining Taseko in 2008,

he was the Operations General Foreman at Hudson Bay Mining and Smelting’s Flin Flon Copper/Zinc Concentrator and prior to that, he held the position of Senior Mill Metallurgist.

Katherine Gizikoff - Director, Government and Environmental Affairs – Katherine is a professional agrologist with 28

years experience at coal and metal mines in Western Canada. Prior to joining Taseko in 2007, Katherine was consulting, providing environmental management, reclamation, research, and permitting services for the mining industry in BC. Prior to that, she was an environmental coordinator for Manalta Coal in Alberta, with earlier work experience at Elkview and Similco. Katherine has extensive experience with government-industry committees, facilitation, community liaison and consultation.

Tomas Alba - Manager, Marketing and Logistics – Tomas is an Industrial Engineer with a graduate degree in Transport and

Maritime Studies with more than 20 years of experience in the mining industry. Prior to joining Taseko in June 2011, he was Marketing and Logistics Manager at Farallon Mining. He also spent more than 10 years working for Carbocol, Colombian coal mining industry, where he held progressively responsible roles up to and including Director of General Sales.

Appendix 4: Experienced Management Team

28

slide-29
SLIDE 29

Mineral Reserves @ C$5.50 NSR/t Cut-Off1

Size M Tonnes Grade Recoverable Metal Contained Metal

Au (g/t) Cu (%) Au (M oz) Cu (B lb) Au (M oz) Cu (B lb) P&P reserves 830 0.41 0.23 7.7 3.6 11.0 4.2 M&I Resources 181 0.40 0.30

  • 2.3

1.1 Total 1,011 0.41 0.24

  • 13.3

5.3

Category (at 0.20% Cu Cut-

  • ff)

Size (M Tons) Grade Recoverable Metal Contained Metal

Cu (%) Mo (%) Cu (B lbs) Cu (B lbs) P&P Reserves 802 0.30 0.008 4.3 4.8 M&I Resources* 950 0.30 0.008

  • 5.7

Appendix 5: Reserves and Resources

Prosperity

The mineral resource and reserve estimations were completed by Taseko staff under the supervision of Scott Jones, P.Eng., Vice-President, Engineering and a Qualified Person under National Instrument 43-101. Mr Jones has verified the methods used to determine grade and tonnage in the geological model, reviewed the long range mine plan, and directed the updated economic evaluation. The estimates for the reserves used long term metal prices of US$1.65/lb for copper and US$650/oz for gold and a foreign exchange of C$0.82 per US dollar.. A technical report was filed on www.sedar.com.

Gibraltar

The resource and reserve estimation was completed by Gibraltar mine staff under the supervision of Scott Jones, P.Eng., Vice President, Engineering and a Qualified Person under National Instrument 43-101. Mr Jones has verified the methods used to determine grade and tonnage in the geological model, reviewed the long range mine plan, and directed the updated economic evaluation. The estimates used long term metal prices of US$2.25lb for copper and US$14.00/lb for molybdenum and a foreign exchange of US$0.85/C$1.00. Mr Jones has reviewed this release. A technical report will be filed on www.sedar.com.

Aley

The 0.20% Nb2O5 cut-off assumes a metal price of US$50.00/kg Nb with process recovery of 50%. G & A, processing and ore mining costs were assumed to be $30/tonne milled with waste mining costs of $1.50/tonne. A 45°wall slope LG pit was generated to constrain the resource within the block model. Detailed engineering studies will determine the optimal cut-off. The resource estimate was prepared by Ronald G. Simpson, P.Geo. with Geosim Services Inc., a Qualified Person independent of Taseko, The qualified person reviewed and approved the contents of this news release.

Category (at 0.20% Nb205 Cut-

  • ff)

Size (M Tons) Grade Recoverable Metal Contained Metal Nb205 (%) Nb (M kgs) Nb (M kgs)

Inferred Reserves

159 0.43 239 4.8

29