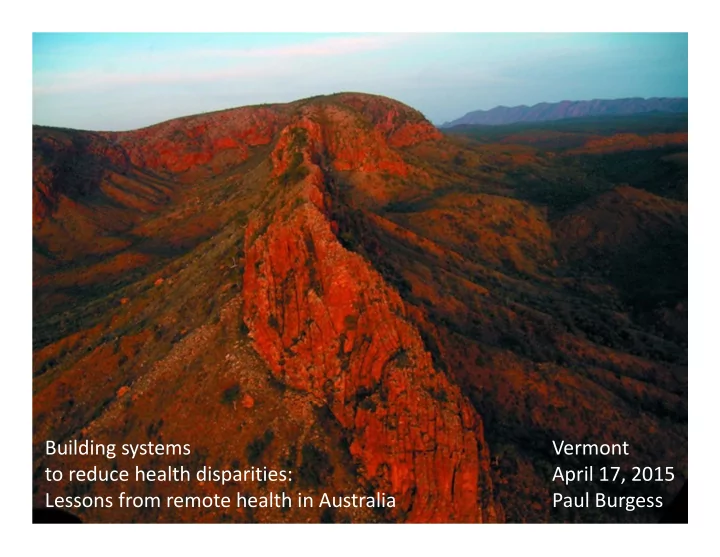

Building systems Vermont to reduce health disparities: April 17, 2015 Lessons from remote health in Australia Paul Burgess
Outline • Where I come from • Progress on health equity
Key Demographics: • 21.5 million people • 550,000 Indigenous (2.5%) • 99.3 million sheep • 625,000 New Zealanders (15% of NZ) Health Score Card Life expectancy: 83Y (#10) Spend: 3,800 pp ($USD) 9.5% of GDP
Where I’m from
The The wo world’s wo worst rst new newspaper paper
NT Health Providers Aboriginal Private GPs Controlled Shared health information NT Government
Clinical context – tough job • 34,000 mobile patients over 1.4 million Km 2 • Triple whammy: IFD/Low SES/Chronic diseases • Nurse led primary care + Aboriginal workers • High staff turnover (non ‐ Aboriginal) • Language/Cultural barriers • Evolving IT • Distance!
Indigenous Demography
Social Determinants of Health dominate
NT Trends in avoidable hospitalisation 1998-2006 Hospital Hospital separations NT Indigenous NT non-Indigenous separations per 100 000 per 100 000 Vaccine Vaccine 18000 18000 Acute Acute 16000 16000 Chronic Chronic 14000 14000 12000 12000 10000 10000 8000 8000 6000 6000 4000 4000 2000 2000 0 0 Li SQ et al. (2009) Avoidable Hospitalisation in Aboriginal and non-Aboriginal people in the Northern Territory MJA
Medical/Nursing Workforce Multiple strategies implemented over decades Undergraduate Rural Health clubs, Rural training schools, Rural student intake Bonded medical school placements Rural training rotations, John Flynn Scholarships Prevocational Electives Placements in rural medicine Vocational Regional training providers Flexible training, Incentives
February 13, 2008
Signific Sign ificant Health Health Impr provem emen ents ts Figure A.6 Death rates per 100 000 standard population, 1998–2031, Northern Territory Actual Indigenous Rate per 100 000 2500 Projected Indigenous rate Indigenous variability bands Actual non-Indigenous 2000 Projected non-Indigenous rate Indigenous trend 2006-2011 1500 Indigenous trend 1998-2011 1000 500 0 1998 1999 2000 2001 2002 2003 2004 2005 2006 2007 2008 2009 2010 2011 2012 2013 2014 2015 2016 2017 2018 2019 2020 2021 2022 2023 2024 2025 2026 2027 2028 2029 2030 2031 Source: ABS and AIHW—see Appendix D.
Take ‐ home Messages?
Policy & Community Environment • Free healthcare • Free medication • Aboriginal governance • Local health networks • Hospital + PHC • Primary Health Care • NGO collaborations • Specialist integration & outreach
IT system + Data linkage
Deci Decisi sion on Support Support • Standard treatment manuals • Standing orders • EBM – peer reviewed • Care plan protocols • Electronic prescribing • Safety functions • Electronic FFS billing • 24/7 phone support
Deliv livery Syst System • Team based PHC • Womb to grave • Cross ‐ training • Care pathways • STM – common conditions • Integrated specialist care • E –consults • Outreach support • allied health • Telemedicine • 24/7 access to care • Radiology
Self ‐ management
Organisation of Care • Strong leadership • Strategic policy work • Collaborations • Teaching • Data driven improvements – AHKPIs – CQI – Functional reporting • Data linkage/Research
Key Performance Indicators (N=22)
Quality Improvement
Improvement of systems by health centre 5.0 Levels of system improvement (measured by ACIC scores 4.0 3.0 2.0 - 1.0 0.0 E A H F B D I G C J K L Intervention group I Group II Group III -1.0 Communities
Organis ational influence 11 10 9 8 Integration E xternal linkages 7 6 5 4 3 2 1 0 Information s ys tems Self-management s opport D elivery s ys tem des ign D ecis ion s upport Baseline Year 1 Year 2
Functional reporting
BP control (<130/90) for high CVR 20 30 40 50 60 70 80 Jun ‐ 12 Jul ‐ 12 Aug ‐ 12 Sep ‐ 12 Oct ‐ 12 Nov ‐ 12 Dec ‐ 12 Jan ‐ 13 Feb ‐ 13 Mar ‐ 13 Apr ‐ 13 May ‐ 13 Jun ‐ 13 Jul ‐ 13 Aug ‐ 13 Sep ‐ 13 Oct ‐ 13 Nov ‐ 13 Dec ‐ 13 Jan ‐ 14 Feb ‐ 14 Mar ‐ 14 Apr ‐ 14 May ‐ 14 Inertia The Gap Outcome % CVRA
4 Population (bubble size-100 persons) Quadratic model rson-year year 3 r pers ns per p 2 italisations p Hospitalisatio 1 Ho 0 0 10 20 30 40 50 Clin linic ic visits pe visits per r person-year person-year
Acknowledgements • Gary Sinclair, Christine Connors, Steve Guthridge, Mark Ramjan, John Wakerman, Ross Bailie, • Remote Medical Practitioners, • Remote Area Nurses, • Aboriginal Health Workers • Aboriginal communities
Harkness Project • How have health organisations extended upon the medical home to proactively identify and address the needs of vulnerable populations? • Multi ‐ level case study analysis – Context: policy/funding/ACA – Leadership – Operational – Consumer experience
Case study sites • North Carolina • Oregon • Vermont • Alaska
Reflections & preliminary findings
Recommend
More recommend