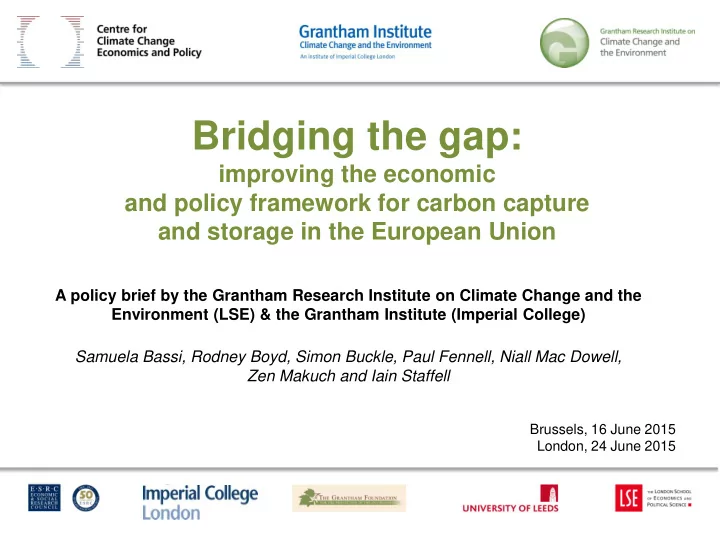
SLIDE 5 CCS in 2C scenarios (2050)
Source Scenario CCS generation % total generation CCS capacity World TWh % GW IEA 2DS base 6,299 15% 960 2DS hiRen 2,945 7% 460 2DS hiNuc 3,055 7% 470 2DS no CCS 0% Global Energy Assessment Mix 18,158 35% n/a Efficiency 9,441 22% n/a Supply 11,761 20% n/a European Union EU Commission Low nuclear 1,548 32% 248 Diversified 1,189 24% 193 High energy efficiency 878 21% 149 Delayed CCS 926 19% 148 High RES 355 7% 53 Energy Modelling Forum (EMF28) 80% DEF 570 14% n/a 80%EFF 536 14% 80% PESS 0% 80% GREEN 0% Global Energy Assessment Mix 2,470 37% n/a Supply 1,841 26% n/a Efficiency 990 19% n/a
Sources: IEA, 2012; EMF 28: Knopf et al., 2013; European Commission, 2011c; UKERC, 2013 ; CCC, 2010 ; HMG, 2011; Utrecht University, 2014; GEA, 2012
All scenarios in EU Energy Roadmap 2050 include CCS
- CCS up to 50% of electricity by
2050
- Some scenarios not feasible
without CCS
- If feasible, more expensive
(IPCC: +140%)