SLIDE 1
bounding-box
April 9, 2019
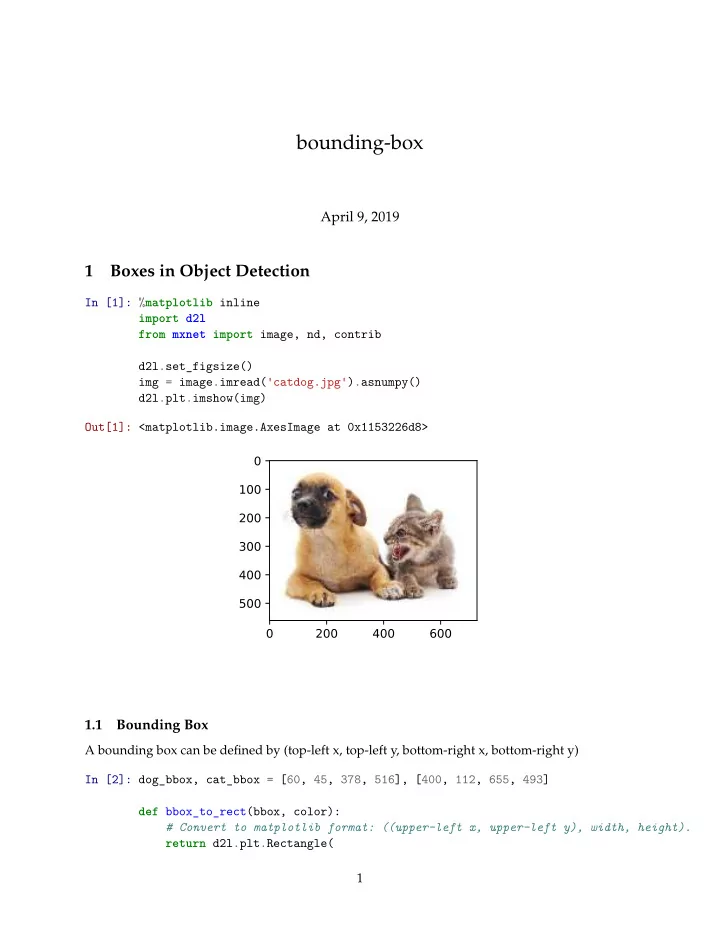
1 Boxes in Object Detection
In [1]: %matplotlib inline import d2l from mxnet import image, nd, contrib d2l.set_figsize() img = image.imread('catdog.jpg').asnumpy() d2l.plt.imshow(img) Out[1]: <matplotlib.image.AxesImage at 0x1153226d8>
1.1 Bounding Box
A bounding box can be defined by (top-left x, top-left y, bottom-right x, bottom-right y) In [2]: dog_bbox, cat_bbox = [60, 45, 378, 516], [400, 112, 655, 493] def bbox_to_rect(bbox, color): # Convert to matplotlib format: ((upper-left x, upper-left y), width, height). return d2l.plt.Rectangle( 1
SLIDE 2 xy=(bbox[0], bbox[1]), width=bbox[2]-bbox[0], height=bbox[3]-bbox[1], fill=False, edgecolor=color, linewidth=2) fig = d2l.plt.imshow(img) fig.axes.add_patch(bbox_to_rect(dog_bbox, 'blue')) fig.axes.add_patch(bbox_to_rect(cat_bbox, 'red'));
1.2 Anchor Boxes
Utility functions to draw multiple boxes in an image. In [3]: def show_bboxes(axes, bboxes, labels=None, colors=None): def _make_list(obj, default_values=None): if obj is None:
elif not isinstance(obj, (list, tuple)):
return obj labels = _make_list(labels) colors = _make_list(colors, ['b', 'g', 'r', 'm', 'c']) for i, bbox in enumerate(bboxes): color = colors[i % len(colors)] rect = d2l.bbox_to_rect(bbox.asnumpy(), color) axes.add_patch(rect) if labels and len(labels) > i: text_color = 'k' if color == 'w' else 'w' 2
SLIDE 3
axes.text(rect.xy[0], rect.xy[1], labels[i], va='center', ha='center', fontsize=9, color=text_color, bbox=dict(facecolor=color, lw=0)) Anchor boxes centered on (250, 250) In [4]: h, w = img.shape[0:2] X = nd.random.uniform(shape=(1, 3, h, w)) # Construct input data. Y = contrib.nd.MultiBoxPrior(X, sizes=[0.75, 0.5, 0.25], ratios=[1, 2, 0.5]) boxes = Y.reshape((h, w, 5, 4)) print(boxes[250, 250, 0, :]) bbox_scale = nd.array((w, h, w, h)) fig = d2l.plt.imshow(img) show_bboxes(fig.axes, boxes[250, 250, :, :] * bbox_scale, ['s=0.75, r=1', 's=0.5, r=1', 's=0.25, r=1', 's=0.75, r=2', 's=0.75, r=0.5']) [0.05511677 0.07152405 0.63307005 0.821524 ] <NDArray 4 @cpu(0)> 3
SLIDE 4
1.3 Labeling Training Set Anchor Boxes
In [5]: ground_truth = nd.array([[0, 0.1, 0.08, 0.52, 0.92], [1, 0.55, 0.2, 0.9, 0.88]]) anchors = nd.array([[0, 0.1, 0.2, 0.3], [0.15, 0.2, 0.4, 0.4], [0.63, 0.05, 0.88, 0.98], [0.66, 0.45, 0.8, 0.8], [0.57, 0.3, 0.92, 0.9]]) fig = d2l.plt.imshow(img) show_bboxes(fig.axes, ground_truth[:, 1:] * bbox_scale, ['dog', 'cat'], 'k') show_bboxes(fig.axes, anchors * bbox_scale, ['0', '1', '2', '3', '4']); Map each anchor box to a bounding box or background In [6]: labels = contrib.nd.MultiBoxTarget(anchors.expand_dims(axis=0), ground_truth.expand_dims(axis=0), nd.zeros((1, 3, 5))) # assigned labels: (batch_size, #anchors) print(labels[2]) # masks: (batch_size, 4 x #anchors), 0 for background, 1 for object print(labels[1]) # offset to bounding boxes: (batch_size, 4 x #anchors) print(labels[0]) [[0. 1. 2. 0. 2.]] <NDArray 1x5 @cpu(0)> 4
SLIDE 5 [[0. 0. 0. 0. 1. 1. 1. 1. 1. 1. 1. 1. 0. 0. 0. 0. 1. 1. 1. 1.]] <NDArray 1x20 @cpu(0)> [[ 0.0000000e+00 0.0000000e+00 0.0000000e+00 0.0000000e+00 1.3999999e+00 9.9999990e+00 2.5939689e+00 7.1754227e+00
2.6881757e-01 1.6823606e+00 -1.5654588e+00 0.0000000e+00 0.0000000e+00 0.0000000e+00 0.0000000e+00
- 5.7142794e-01 -1.0000001e+00 -8.9406973e-07
6.2581623e-01]] <NDArray 1x20 @cpu(0)>
1.4 Output Bounding Boxes for Prediction
In [7]: anchors = nd.array([[0.1, 0.08, 0.52, 0.92], [0.08, 0.2, 0.56, 0.95], [0.15, 0.3, 0.62, 0.91], [0.55, 0.2, 0.9, 0.88]])
- ffset_preds = nd.array([0] * anchors.size)
cls_probs = nd.array([[0] * 4, # Predicted probability for background [0.9, 0.8, 0.7, 0.1], # Predicted probability for dog [0.1, 0.2, 0.3, 0.9]]) # Predicted probability for cat fig = d2l.plt.imshow(img) show_bboxes(fig.axes, anchors * bbox_scale, ['dog=0.9', 'dog=0.8', 'dog=0.7', 'cat=0.9']) Non-maximum suppression: In [8]: import numpy as np np.set_printoptions(2) 5
SLIDE 6
- utput = contrib.ndarray.MultiBoxDetection(
cls_probs.expand_dims(axis=0), offset_preds.expand_dims(axis=0), anchors.expand_dims(axis=0), nms_threshold=0.5)
Out[8]: [[[ 0. 0.9 0.1 0.08 0.52 0.92] [ 1. 0.9 0.55 0.2 0.9 0.88] [-1. 0.8 0.08 0.2 0.56 0.95] [-1. 0.7 0.15 0.3 0.62 0.91]]] <NDArray 1x4x6 @cpu(0)> Visualize the results In [9]: fig = d2l.plt.imshow(img) for i in output[0].asnumpy(): if i[0] == -1: continue label = ('dog=', 'cat=')[int(i[0])] + str(i[1]) show_bboxes(fig.axes, [nd.array(i[2:]) * bbox_scale], label)
1.5 Multiscale Object Detection
In [10]: def display_anchors(fmap_w, fmap_h, s): fmap = nd.zeros((1, 10, fmap_w, fmap_h)) # The values from the first two dimensions 6
SLIDE 7
anchors = contrib.nd.MultiBoxPrior(fmap, sizes=s, ratios=[1, 2, 0.5]) bbox_scale = nd.array((w, h, w, h)) d2l.show_bboxes(d2l.plt.imshow(img).axes, anchors[0] * bbox_scale) display_anchors(fmap_w=4, fmap_h=4, s=[0.15]) In [11]: display_anchors(fmap_w=2, fmap_h=2, s=[0.4]) 7
SLIDE 8
In [12]: display_anchors(fmap_w=1, fmap_h=1, s=[0.8]) 8