BIOE 301/362 Perinatal conditions 1. Lower respiratory infections - - PDF document

bioe 301 362
SMART_READER_LITE
LIVE PREVIEW

BIOE 301/362 Perinatal conditions 1. Lower respiratory infections - - PDF document

Review of Lecture Two: Leading Causes of Mortality, Birth-Age 4 Developing world BIOE 301/362 Perinatal conditions 1. Lower respiratory infections 2. Lecture Three: Diarrheal diseases 3. Malaria Leading Causes of Mortality, Ages


slide-1
SLIDE 1

BIOE 301/362

Geoff Preidis MD/PhD candidate Baylor College of Medicine preidis@post.harvard.edu

Lecture Three:

Leading Causes of Mortality, Ages 15-44

Review of Lecture Two:

Leading Causes of Mortality, Birth-Age 4

  • Developing world

1.

Perinatal conditions

2.

Lower respiratory infections

3.

Diarrheal diseases

4.

Malaria

  • Developed world

1.

Perinatal conditions

2.

Congenital anomalies

3.

Lower respiratory infections

4.

Unintentional injuries

Group 1 Communicable diseases, maternal/perinatal conditions, nutritional deficiencies Group 2 Non-communicable diseases (cardiovascular, cancer, mental disorders) Group 3 Injuries

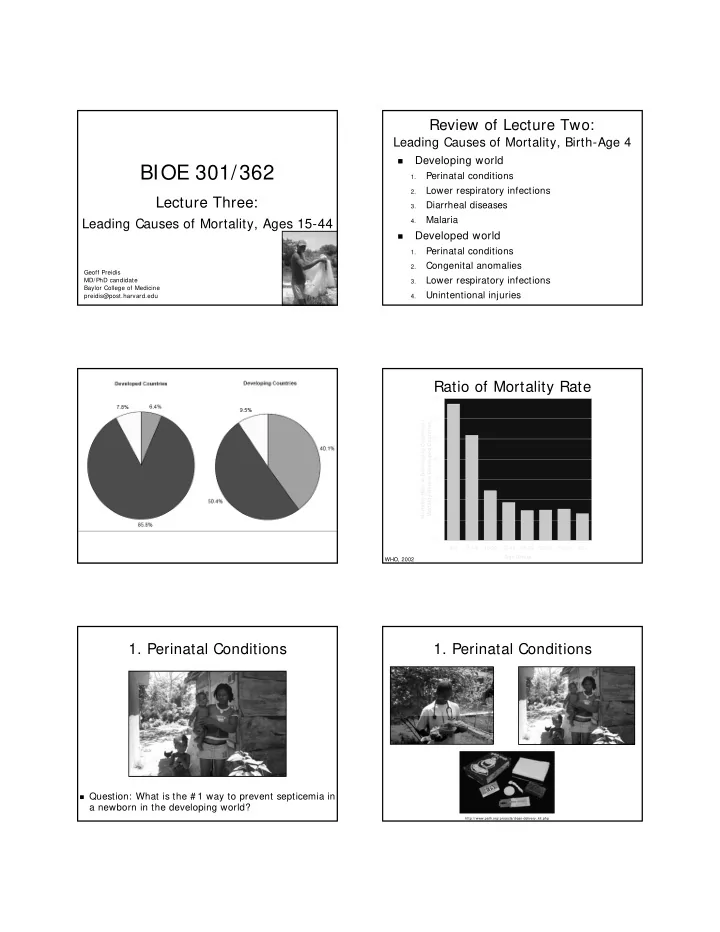
Ratio of Mortality Rate

0.0 1.0 2.0 3.0 4.0 5.0 6.0 7.0 0-4 5-14 15-29 30-44 45-59 60-69 70-79 80+ Age Group Mortality Rate in Developing Countries / Mortality Rate in Developed Countries WHO, 2002

  • 1. Perinatal Conditions

Question: What is the # 1 way to prevent septicemia in

a newborn in the developing world?

  • 1. Perinatal Conditions

http://www.path.org/projects/clean-delivery_kit.php

slide-2
SLIDE 2
  • 2. Lower Respiratory Infections

Question: How can a

busy health worker (or a parent) quickly screen for pneumonia in a child?

  • 2. Lower Respiratory Infections
  • 3. Diarrheal Diseases

Question: What is the # 1 way to prevent

diarrheal illness in a newborn?

  • 3. Diarrheal Diseases
  • 4. Malaria
  • Question: How was malaria eradicated from

the southern U.S.? What are the challenges with implementing this technology in less developed countries?

Challenges for implementing

vector control technologies in developing countries

Mapping areas that are difficult to

access

Poor communication Direction – Transfer of vector control

efforts from malaria control authorities to local primary health care center

Financial support – decreased

standard of living from wars, environmental factors, migration

Corruption, graft

  • 4. Malaria

http://www.cdc.gov/malaria/history/

slide-3
SLIDE 3

Leading Causes of Mortality Ages 15-44

  • Developing World

1.

HIV/AIDS

2.

Unintentional injuries

3.

Cardiovascular diseases

4.

Tuberculosis

  • Developed World

1.

Unintentional injuries

2.

Cardiovascular diseases

3.

Cancer

4.

Self-inflicted injuries

  • 1. HIV/AIDS

Burden of HIV/AIDS Pathophysiology of HIV Clinical course of HIV/AIDS Highly Active Antiretroviral Therapy Prevention of Mother to Child

Transmission (PMTCT)

Burden of HIV/AIDS

Worldwide

33.0 M people living with HIV/AIDS (2 M children) 25 M killed, 11.5 M orphans in Africa alone 2007:

2.0 M deaths 2.7 M new HIV infections 14% of new infections occurred in children (< 15 yrs)

2/3 of those with AIDS and 3/4 of all AIDS deaths

are in sub-Saharan Africa

7400 new infections per day

96% in low- and middle-income countries 1000 children Source: 2008 AIDS Epidemic Update, UNAIDS/WHO

http://www.who.int/whr/2004/en/charts_en.pdf http://www.who.int/whr/2004/en/charts_en.pdf http://www.who.int/whr/2004/en/charts_en.pdf

slide-4
SLIDE 4

Burden of HIV/AIDS in the U.S.

1.2 M people have HIV/AIDS (prevalence) 56,000 new infections per year (incidence) Only 7 countries in the world have more people

living with HIV than the U.S.

Routes of transmission:

Unsafe sex between men (53%) High-risk heterosexual intercourse (31% ) Non-sterile drug injection equipment (12% ) Source: 2008 AIDS Epidemic Update, UNAIDS/WHO

Burden of HIV/AIDS in the U.S.

Racial and ethnic minorities are disproportionately

affected:

50% of HIV diagnoses are African-Americans (15% pop) The rate of new HIV diagnoses was 21x higher in African-

American women than in Caucasian women

Women are increasingly affected:

The proportion of women among new HIV/AIDS diagnoses

have risen from 15% to 26% in 10 years

Question: Why is the prevalence of HIV in the U.S.

continuing to increase?

Source: 2008 AIDS Epidemic Update, UNAIDS/WHO

Pathophysiology of HIV/AIDS

Michael W. Davidson at Florida State University http://bayloraids.org/curriculum/

Pathophysiology of HIV/AIDS

I ntegrase I nhibitors Fusion I nhibitors

Pathophysiology of HIV/AIDS

http://bayloraids.org/curriculum/

Clinical Course of HIV/AIDS

slide-5
SLIDE 5

Clinical Course of HIV/AIDS

http://hivinsite.ucsf.edu/topics/ aids_basics

Clinical Course of HIV/AIDS

http://bayloraids.org/curriculum/

HIV/AIDS Therapy

HIV can rapidly mutate to quickly develop

resistance to a single drug

Resistance develops much more slowly to

drug combinations

Goal of ART:

Reduce viral levels

to undetectable levels

Has reduced death

rate in US and Europe by 80%

HIV/AIDS Therapy

http://www.who.int/whr/2004/en/charts_en.pdf http://www.who.int/whr/2004/en/charts_en.pdf

6 million people living with AIDS are in need of HAART. 90% are in just 34 developing countries

slide-6
SLIDE 6

Prevention of Mother to Child Transmission (PMTCT)

  • 3 routes of transmission:
  • Parentally (during pregnancy)
  • Perinatally (during delivery)
  • Breast feeding (through milk)
  • 4 Core interventions:
  • HIV testing and counseling
  • ARV prophylaxis (ZDV, NVP)
  • Safer delivery practices
  • Safer infant-feeding practices
  • Reduces transmission from 30-40% to 4-6%
  • 2. Unintentional Injuries

Burden of Unintentional Injuries Accident Physics Slowed Driver Reaction Time Prevention of Road Accidents

  • 2. Unintentional Injuries

Burden of Unintentional Injuries

More than 1.25 M people ages 15-44 die

from unintentional injuries each year

1 M deaths in developing countries, 1/4 M

in developed countries

40x this number are injured Major cause of disability Leading cause is road accidents:

500,000 deaths per year in this age group 90% of these deaths occur in developing

countries

Road Accidents in the U.S.

Rates declining steadily A leading cause of potential years of life lost 2008:

37,000 Americans killed 2,500,000 Americans injured Fatal accident rates 3X higher for males than for

females

Motorcycles: 40X higher death rate per mile traveled

39% of fatalities related to alcohol use

Burden of Unintentional Injuries Accident Physics

  • Newton’s 2nd Law:
  • F = m a
  • a = dv/dt
  • a = initial velocity/time to come to rest
  • In a crash:
  • Velocity slows to zero in a very short time
  • Generates large forces
  • How can we reduce these forces?

1.

Reduce initial velocity of impact

2.

Extend time that it takes passengers to come to rest

slide-7
SLIDE 7

Prevention of Road Accidents

  • 1. Reduce initial velocity of impact
  • Excessive speed contributes to:
  • 30% of deaths in developed countries
  • 50% of deaths in developing countries
  • 1. Reduce Initial Velocity of Impact

When drivers anticipate a crash, they have

time to brake and reduce initial velocity

Factors which slow driver reaction time:

Alcohol use Mobile phone use Poor visibility Driver inexperience

  • 1. Reduce Initial Velocity of Impact

Alcohol impaired drivers have 17X increased risk

  • f being in fatal crash

Alcohol use increases risk more in younger

drivers

1 in 5 Americans will be involved in an alcohol-

related crash at some time in their lives

TX BAC limit: 0.08+ g/dl is illegal Approx 3 drinks in a

140 lb individual

Significant driving

impairment at just 0.04 BAC!

  • 1. Reduce Initial Velocity of Impact

Mobile phone use:

At any given daylight moment in US:

10% of drivers are using a cell phone

Increases driver reaction time by 0.5-1.5 seconds Risk of crash is 4X higher when using a mobile phone Same as driving with a BAC of 0.09 g/ dl

6 states and D.C. have banned use of hand held

phones while driving (CA, CT, NJ, NY, OR, WA)

Partial bans in AR, AZ, CO, DE, GA, IL, IN, KY, LA, ME, MD,

MA, MI, MN, NE, NH, NM, NC, OH, PA, RI, TN, TX, UT, VA, WV

TX: Banned for novices (1st 12 mos) and in school crossing

zones

Prevention of Road Accidents

  • 2. Extending Time to Come to Rest:
  • Crumple zones
  • Allow passengers additional time to decelerate
  • Seat belts
  • Keep occupants in the passenger compartment
  • Stretch during impact
  • Reduce risk of death in crash by 40-60%
  • Air bags
  • When combined with seat belts, reduce risk of

serious and fatal injuries by 40-65%

  • Child restraints:
  • Reduce risk of infant death by 71% and toddler

death by 54%

Prevention of Road Accidents

  • 3. Legislation:

Speed Seat belts, Car seats, Air Bags Alcohol use Motorcycle helmets

  • 4. Engineering:

Restraints Safety standards

  • 5. Education:

Seat belts, Car seats, Air Bags Alcohol use

slide-8
SLIDE 8
  • 3. Cardiovascular Diseases

768,000 people ages 15-44 die as a result

  • f cardiovascular disease every year

Most common causes:

Ischemic heart disease (286,000 deaths) Cerebrovascular disease (159,000 deaths)

Will be covered in depth in Lecture 4

Tuberculosis

www.ohsu.edu/library/hom/exhibits/exhimages/200501tb/openair_pavilions.jpg

  • 4. Tuberculosis

Burden of Tuberculosis TB Pathophysiology Diagnosis of Tuberculosis Directly Observed Therapy

Burden of Tuberculosis

Bacterial infection of the lungs caused by

Mycobacterium tuberculosis

Bacterium infects 1 in 3 people on the planet Drugs that cure TB were discovered in 1940s Results in death in 5 years in half of cases if untreated Kills 600,000 people ages 15-44 each year Estimated that TB will kill 35 M people in next 20

years if situation does not change

2007:

9.27 M new cases (incidence) 500,000 cases of MDR-TB 1.7 M deaths 98% of deaths occur in developing world http://www.who.int/tb

Global Tuberculosis Control 2009, WHO

Natural History of TB Infection

slide-9
SLIDE 9

TB Pathophysiology

Active TB:

Symptoms

Fever Night sweats Weight loss Weakness Coughs (productive with bloody sputum)

Airborne transmission Left untreated, one person with active TB can

cough millions of infectious droplets into the air

TB Pathophysiology

TB and AIDS

People with AIDS are 10x more likely to

develop active TB once infected

TB is the leading cause of death among HIV

positive individuals, accounting for 13% of AIDS deaths worldwide

www.ourjeet.com/images/twinepidemics.gif

Diagnosis of Tuberculosis

Skin test (PPD) Serum test Chest X-ray

Shows nodules in

active TB

Sputum

Acid-fast bacilli

Directly Observed Therapy (DOT)

A health care worker watches and helps as the patient

swallows anti-TB medicines in his/her presence.

DOT shifts responsibility for cure from patient to

health care system

Requires political commitment, accurate diagnosis,

quality drugs, observation, follow up

DOT works well in many developing countries

6 month supply is $10 Cure rates of up to 95% even in poorest

countries

17 million patients worldwide have been

treated with DOT since 1995

25% of world’s population does not have

access to DOT.

Directly Observed Therapy (DOT) Leading Causes of Mortality Ages 15-44

  • Developing World

1.

HIV/AIDS

2.

Unintentional injuries

3.

Cardiovascular diseases

4.

Tuberculosis

  • Developed World

1.

Unintentional injuries

2.

Cardiovascular diseases

3.

Cancer

4.

Self-inflicted injuries

slide-10
SLIDE 10
  • 3. Cancer

580,000 people ages 15-44 die as a result

  • f cancer every year

Most common causes:

Liver Cancer (68,000 deaths per year) Leukemias (65,000) Stomach Cancer (58,000) Breast Cancer (57,000)

Will be covered in depth in Lecture 4

  • 4. Self-Inflicted Injuries

Burden of Self-Inflicted Injuries Risk Factors Associated with Suicide Methods of Suicide Screening and Prevention

Burden of Self-Inflicted Injuries

480,000 people ages 15-44 take their own lives

each year (4th leading cause of death)

Unsuccessful attempts are 20x as frequent Unipolar depressive disorder ranks # 1 for DALYs in

this age group in developed countries

Second to HIV/AIDS in developing countries

Highest rate of completed suicides

  • Men > 65 years old

Highest rate of attempted suicides

Men and women ages 20-24

Global suicide rates have increased 60% in the last

45 years

http://www.who.int/mental_health/prevention/suicide/suicideprevent/en/index.html

Risk Factors Associated with Suicide

Psychiatric illness

Affective, substance abuse, personality, other mental

disorders

Other risk factors

Social adjustment problems Serious medical illness Living alone Recent bereavement Personal history of suicide attempt or completion Divorce or separation Unemployment

Methods of Suicide

Most common:

Firearms are used in 60% of suicides

2nd leading cause:

Men: Hanging Women: Drug overdose or poison

Alcohol is involved in 25-40% of suicides Women attempt suicide more often;

men are more often successful

slide-11
SLIDE 11

Screening and Prevention

50-66% of all suicide victims visit

physician < 1 month before event

10-40% in the preceding week Hard to identify who is at risk

Direct questioning has low yield General questions about sleep disturbance,

depressed mood, guilt and hopelessness

Survey instruments aren’t good at predicting

what will happen

Screening and Prevention

How do we quantify the efficacy of such

questionnaires?

Goal of screening:

Catch as many positives as possible, even at the risk of some

false positives

Sensitivity:

Se = probability of testing positive if you will commit suicide

Sensitivity of best questionnaires: 56% (low)

suicide commit who # positive test who # = Se

Screening and Prevention

How many false positives result?

Positive predictive value:

PPV= probability of committing suicide if you test positive

PPV of best questionnaires: 3% (pathetic)

positive test who # suicide commit and positive test who # = PPV

Screening and Prevention

S I G E C A P S

Summary of Lecture 3

  • Developing World

1.

HIV/AIDS

2.

Unintentional injuries

3.

Cardiovascular diseases

4.

Tuberculosis

  • Developed World

1.

Unintentional injuries

2.

Cardiovascular diseases

3.

Cancer

4.

Self-inflicted injuries

Assignments Due Next Time

Project Task 1