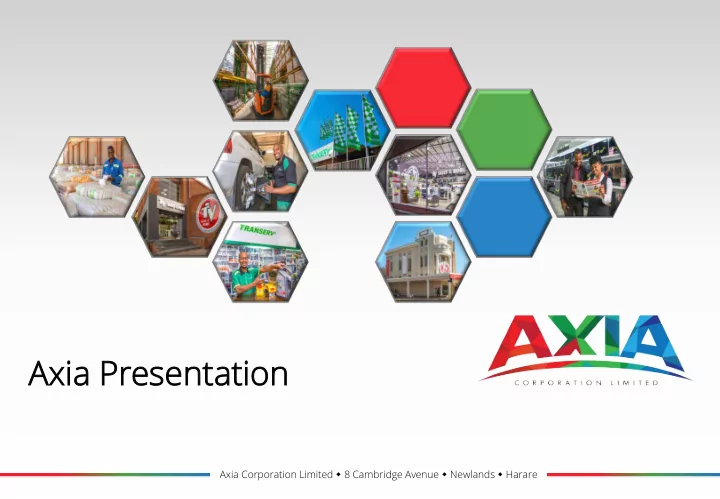

Axia P Presen sentation ion Axia Corporation Limited 8 Cambridge Avenue Newlands Harare
Conten tents ts Introduction Chief Executive Officer Financial Review Finance Director Conclusion & Outlook Chief Executive Officer
Intr ntrod oducti tion on Axia Corporation Limited 8 Cambridge Avenue Newlands Harare
TV V Sal ales & s & Home 326 Employees 43 Retail Sites 35 Delivery Vehicles * Information as at 30 th June 2018
Transe anserv rv 342 Employees 43 Retail Branches and Fitment Centers * Information as at 30 th June 2018
Distrib ributio ion Group A Afric ica 1,177 Employees 942 in Zimbabwe 154 in Zambia 81 in Malawi Owns two warehouses measuring 10,000 sqm and leases five warehouses measuring 16,182 sqm Has a fleet of 99 vehicles * Information as at 30 th June 2018
Macr cro Econ Economic En Envir ironment Shortage of foreign currency Challenges in acquiring some import licenses Constrained consumer disposable income Increasing price sensitivity by customers Loss of value of liquid assets (cash) Economic difficulties in Zambia
Financ inancia ial R l Revi view Axia Corporation Limited 8 Cambridge Avenue Newlands Harare
Income me S Stateme ment FY2018 FY2017 % Chg ACTUAL ACTUAL Actual USD '000 USD '000 vs. FY2017 REVENUE 275,925 224,943 23% GROSS MARGIN 66,472 53,105 25% TOTAL OVERHEADS 39,979 36,567 9% OPERATING PROFIT BEFORE 25,808 16,538 56% DEPRECIATION AND AMORTISATION (EBITDA) FINANCIAL INCOME 1,274 1,200 DEPRECIATION & AMORTISATION (1,913) (1,606) FAIR VALUE ADJUSTMENTS ON LISTED EQUITIES 68 70 PROFIT BEFORE INTEREST AND TAX 24,818 16,202 53%
Income me S Stateme ment (con ontin inued) ) FY2018 FY2017 % Chg ACTUAL ACTUAL Actual USD '000 USD '000 vs. FY2017 PROFIT BEFORE INTEREST AND TAX 24,818 16,202 53% NET INTEREST EXPENSE (1,282) (687) EQUITY ACCOUNTED EARNINGS 799 840 PROFIT BEFORE TAX 24,335 16,355 49% TAX EXPENSE (7,452) (4,408) PROFIT AFTER TAX (USD) 16,883 11,947 41% NON -CONTROLLING INTERESTS (5,930) (4,531) ATTRIBUTABLE PROFIT (BASIC) 10,953 7,415 48% ATTRIBUTABLE PROFIT (HEADLINE) 10,964 7,402 HEADLINE EARNINGS PER SHARE (CENTS) 2.02 1.37 48% TOTAL DIVIDEND PER SHARE (CENTS) 0.72 0.54 33%
Income me Stateme ment C Contrib ibutors Revenue Gross Margin EBITDA TV Sales & Home 36% 37% 59% Transerv 31% 4% 3% Distribution Group Africa Zimbabwe 17% 15% 55% Distribution Group Africa Region 29% 33% 29%
Statement of of Fin inancia ial P l Posit osition ion – Asse ssets B s Breakdown 30 JUNE 2018 30 JUNE 2017 audited audited USD '000 USD '000 ASSETS Non-current assets fixed assets 9,085 6,737 intangible assets 35 35 investments in associates 5,618 4,719 loan receivable from associate - 1,321 deferred tax assets 2,023 1,632 16% 16,761 14,444 Current assets financial assets 1,690 921 inventories 47,750 30,948 trade and other receivables 54,088 47,388 cash and cash equivalents 7,297 10,738 23% 110,825 89,995 Total Assets 127,586 104,439 22%
Statement of of Fin inancia ial P l Posit osition ion – Equity & & Lia iabil ilit ities s 30 JUNE 2018 30 JUNE 2017 audited audited USD '000 USD '000 Capital and reserves ordinary share capital 54 54 share based payment 162 14 non-distributable reserves (2,682) (2,535) distributable reserves 43,350 36,612 Minority interests 24,774 22,737 Total shareholders' equity 65,658 56,882 15% Non-current liabilities provision for deferred taxation 1,756 1,753 interest bearing debt- third party - 1,375 1,756 3,128 44% Current liabilities interest bearing debt- third party 26,055 17,563 trade and other payables 32,361 25,316 provisions and other liabilities 944 634 current tax liabilities 812 916 60,172 44,429 35% Total Liabilities 61,928 47,557 30% Total Equity and Liabilities 127,586 104,439 22% Net Gearing 20.45% 10.82%
Foreign ign I Inventory & Creditors rs INVENTORY Obsolence 30 June 2018 30 June 2018 30 June 2017 30 June 2017 Foreign Local Provision Total Foreign Total Foreign USD '000 USD '000 USD '000 USD '000 % USD '000 % TV Sales & Home 8,547 7,638 (118) 16,068 53% 10,706 67% Transerv 8,437 429 (831) 8,035 95% 8,829 93% DGA Zim 20,098 5,571 (438) 25,231 78% 17,156 81% DGA Region 4,596 1,984 (129) 6,451 70% 3,086 84% Less: Transerv (8,437) (429) 831 (8,035) -95% (8,829) (93%) 33,241 15,193 (685) 47,750 69% 30,948 78% 30 June 2018 30 June 2018 30 June 2017 30 June 2017 CREDITORS Foreign Local Total Foreign Total Foreign USD '000 USD '000 USD '000 % USD '000 % TV Sales & Home 159 5,729 5,888 3% 4,783 4% Transerv - 1,498 1,498 0% 4,284 73% DGA Zim 7,951 14,031 21,983 36% 16,440 45% DGA Region 3,536 3,387 6,922 51% 3,370 32% Less: Transerv - (1,498) (1,498) 0% (4,284) (73%) Axia Corp - 1,949 1,949 - 926 - Axia Ops - 1,034 1,034 - 2,524 - Excalibur & ICRML - 76 76 - 80 - Adjustments - Intercompany & o - (5,490) (5,490) - (2,807) - 11,646 20,716 32,361 36% 25,316 38% Foreign creditors as a percentage of foreign inventory 35% (30 June 2018) Foreign creditors as a percentage of foreign inventory 35% (30 June 2017)
Statement o of C Cashflo lows 30 JUNE 2018 30 JUNE 2017 audited audited USD '000 USD '000 Cash generated from operating activities 10,136 3,874 net interest paid (1,282) (354) tax paid (7,159) (5,455) Net cash generated from / (utlised in) operating activities 1,694 (1,934) Investing activities (4,511) (1,977) Net cash outflow before financing activities (2,817) (3,912) Financing activities (625) 1,439 Decrease in cash and cash equivalents (3,441) (2,473) Cash and cash equivalents at the beginning of the year 10,738 13,211 Cash and cash equivalents at the end of the year 7,297 10,738
CONC ONCLUSION ON
John Koumides, es, C Chief Executive O ve Offic icer er T: +263 (24) 2776 250 E: johnk@axiaops.com Ray ay Ramb ambanap anapas asi, F Financ nance D Director T: +263 (24) 2776 998 E: rayr@axiaops.com www.axiacorpltd.com
Recommend
More recommend