
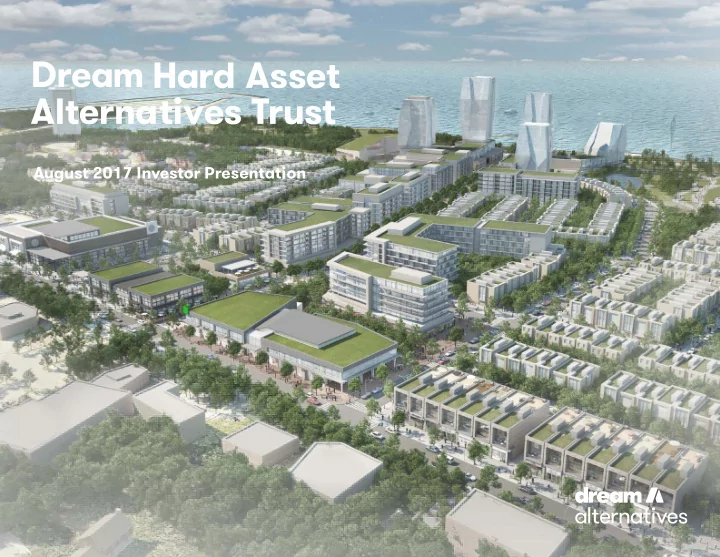
SLIDE 1
August 2017 Investor Presentation
August 2017 Investor Presentation Dream Hard Asset Alternatives - - PowerPoint PPT Presentation
August 2017 Investor Presentation Dream Hard Asset Alternatives Trust At-a-glance Dream Hard Asset Alternatives Trust (DAT) is a mutual fund trust, focused on hard asset alternative investments comprising real estate, real estate development,
August 2017 Investor Presentation
Dream Hard Asset Alternatives Trust
*Implied yield is based on fjxed distribution of $0.40 per unit and TSX closing price as at August 10, 2017. Unlike fjxed income securities, there is no obligation on DAT to distribute to unitholders any fjxed amount, and reductions in, or suspensions of, cash distributions may occur that would reduce the yield based on market price. Development
Implied yield - Tax effjcient distributions
Renewable Power
Approximately
in total assets
Income Property Re-development potential
Development
Debt to Gross Asset Value
Low leverage and conservative balance sheet.
Development
Managed by
an experienced asset manager with a successful track record
Income properties Mortgages and Loans Energy and Infrastructure Development
Lending Portfolio
Dream Hard Asset Alternatives Trust (DAT) is a mutual fund trust, focused on hard asset alternative investments comprising real estate, real estate development, real estate lending and infrastructure, including renewable power.
DAT Investor Presentation | 2
Dream Hard Asset Alternatives Trust | The Manager
DAT is managed by Dream. Dream started as a public company in 1996 with $500,000 of equity and has grown to its current equity value of $826 million representing an internal rate of return* of 32%. .
*IRR (Internal Rate of Return) represents the discount rate of annual net cash paid out to shareholders and the equity value (including minority interest) as at June 30, 2017 over the initial investment in 2003)
State Street Financial Centre Toronto, Ontario
DAT Investor Presentation | 3
Dream Hard Asset Alternatives Trust | Dream Platform
DAT is able to leverage all of Dream’s activities, relationships and expertise and take advantage of Dream’s experience and track record. Dream’s platform benefjts DAT by providing: Capital markets expertise Track record of value creation Asset management capabilities Transaction expertise
DAT Investor Presentation | 4
Dream Hard Asset Alternatives Trust
We believe that hard asset alternative investments provide diversifjcation from the traditional asset classes available broadly to investors.
Million in Portfolio Net Asset Value
in Mortgages and Loans
in Income Properties co-owned with Dream Offjce REIT and Dream Industrial REIT
in Development & Investment Holdings
in Renewable Power Assets
Please see page 6 of the MD&A for further information on the portfolio breakdown.
DAT Investor Presentation | 5
Dream Hard Asset Alternatives Trust
GTA & South Western Ontario
Other Western Canada
Eastern Canada
Saskatchewan
United Kingdom
British Columbia
DAT Investor Presentation | 6
Dream Hard Asset Alternatives Trust | Objectives & Benefjts
Provide an opportunity for unit-holders to invest in hard asset alternative investments, including real estate, real estate lending, real estate development and infrastructure including renewable power; Build and maintain a growth-oriented portfolio; Provide predictable and sustainable cash distributions to unit-holders on a tax-effjcient basis; and Grow and re-position the portfolio to increase both the Adjusted Funds Available for Distribution (AFAD) and Net Asset Value (NAV) per unit over time.
Alternative Assets
Attractive returns Low correlation with traditional asset classes Hedge against infmation Difgerent risk characteristics
DAT Investor Presentation | 7
Dream Hard Asset Alternatives Trust
A portfolio of offjce, industrial and retail commercial real estate properties in Canada, a majority
Interest-paying mortgages and corporate loans. Solar and wind power projects in Canada and the United Kingdom that are operational or under con- struction.
Income Properties Lending Portfolio Development & Investment Holdings Renewable Power
Participating mortgages receiv- able and indirect investments in developments and income-produc- ing properties.
DAT Investor Presentation | 8
Contributes to Tax-effjciency Income Growth Stability of Cash-fmow NAV Growth Hedge Against Infmation Stability of Cash-fmow Income Growth Preserves NAV Hedge Against Infmation (short term loans) Income Growth NAV growth Hedge Against Infmation Stability of Cash-fmow (20-year fjxed contracts) Contributes to Tax-effjciency Income Growth NAV Growth Power Purchase Agreements may be indexed to infmation
Dream Hard Asset Alternatives Trust
Increasing the NAV per unit over time is a strategic focus for DAT and may be driven by: Net Asset Value* Per Segment
Net asset value “NAV” represents the net assets attributable to unitholders of the Trust, including adjustments to remove deferred income taxes payable or receivable, Deferred Unit Incentive Plan payable, and the unamortized balance of the net lending portfolio discount and mortgages payable premiums that are included in net assets on the Trust’s consolidated statements of fjnancial position. For defjnition of the non-IFRS measures, please refer to the Q2 2017 MD&A. *Based on net asset value as at June 30, 2017 as disclosed in the Financial Statements.
$8.79 $5.71
DAT Investor Presentation | 9
Renewable power projects becoming operational Repositioning of the income properties assets Completion of the development projects
Dream Hard Asset Alternatives Trust
Real estate investing in income properties is cyclical but, historically, has provided attractive risk-adjusted returns. Compared to stocks and bonds, real estate investing generally ofgers posi- tive and stable cash fmows, attractive yields, more consistent returns in periods of market volatility, and hedging capabilities against infmation.
West Metro Corporate Centre The West Mall | Toronto, Ontario
DAT Investor Presentation | 10
Dream Hard Asset Alternatives Trust | Income-Producing Properties
The majority of our income properties are co-owned with Dream Offjce REIT, and Dream Industrial REIT, Canada’s largest pure-play industrial REIT.
Income Properties
Square Feet of owned GLA**
Diversifjed Tenants
Weighted Average Remaining Lease Term
Committed and In-place Occupancy
Gross IFRS Asset Value*
Victoria London Kamloops Regina Ottawa Toronto & GTA Halifax
* Refer to page 10 of the Q2 2017 MD&A for further detail. **at DAT’s share
DAT Investor Presentation | 11
Dream Hard Asset Alternatives Trust | Income-Producing Properties
Debt Maturities
Sussex Center Mississauga, Ontario
Our strong fjnancial position and active asset management will enable us to focus on acquisition, disposition and future re-development opportunities.
Debt maturities are based on total maturity balance and principal repayments as at June 30, 2017.
Lease Expiries Net of Committed Renewals as a Percentage of GLA
DAT Investor Presentation | 12
Dream Hard Asset Alternatives Trust | Income-Producing Properties
Our tenant base includes municipal, provincial, and federal governments as well as a wide range of larger, high quality international corporations. Our focus on strategic leasing should contribute to higher income potential for the properties.
Tenant Number of Buildings GLA
(DAT's Share)
% of Total GLA % of Total Income Properties Revenue Remaining Lease Term Credit Rating* TD Canada Trust 1 222,846 27.2% 20.4% 6.3 AA- Technicolor Creative Services 1 83,770 10.2% 12.4% 5.7 NA Edward D. Jones & Co. 1 39,256 4.8% 6.6% 2.8 NA Community Door Network Service 2 30,828 3.8% 3.5% 4.5 NA Cardinia Real Estate Canada Inc. 1 18,490 2.3% 2.4% 0.3 NA Total 395,190 48.3% 45.3% 5.4
* Credit ratings obtained from Standard & Poor’s and Egan Jones, which may refmect the parent’s or a guarantor’s credit rating.
DAT Investor Presentation | 13
Dream Hard Asset Alternatives Trust
Traditional real estate lending continues to be valuable by providing a base return while we seek
returns. In addition, we believe that maintaining an allocation to traditional real estate lending provides more stable returns during economic uncertainty.
InGastown Vancouver | British Columbia
DAT Investor Presentation | 14
Dream Hard Asset Alternatives Trust | Lending Portfolio
Our mortgages are secured by all types of residential and commercial real estate property. We typically fjnance properties with lower risk profjles, such as multi-family residential rental properties and stabilized income properties. We also invest in higher yielding developer and construction loans when we are comfortable with the underlying security and covenant of the borrower.
Mortgages and Corporate Loans
Weighted Average Efgective Interest Rate
Weighted Average Remaining Term to Maturity
Waterloo Vancouver Prince George Calgary Regina Ottawa Toronto GTA Halifax Saint George
First Mortgages
DAT Investor Presentation | 15
Dream Hard Asset Alternatives Trust | Lending Portfolio
Maturity Summary of Lending Portfolio* Sector Allocation of Lending Portfolio
*Based on contractual maturity dates of loans which may be refjnanced subject to terms, conditions and management decisions. As at June 30, 2017.
DAT Investor Presentation | 16
Short term loans provide attractive returns while we seek longer term higher yielding
Reduced risk in the lending portfolio through sector diversification and focusing on Dream's core competency as a developer.
Dream Hard Asset Alternatives Trust
Real estate development can range from renovation and re-leasing of existing assets to acquisition of raw land for new development. Dream is very active in the development business and has its own engineers, construction managers, development offjcers and marketing offjcers on stafg.
Empire Eau Du Soleil Toronto | Ontario
DAT Investor Presentation | 17
Dream Hard Asset Alternatives Trust | Development and Investment Holdings
Multi-Residential development projects in downtown Toronto and the GTA.
Hotel PUR, in the heart of Quebec City, Quebec.
in three shopping centres and
managed by RioCan REIT.
Edmonton Winnipeg Quebec City Toronto GTA
Our development projects are with strong partners with a long track record. DAT Investor Presentation | 18
Dream Hard Asset Alternatives Trust | Development and Investment Holdings
Status Investment Fair Value ($ millions)* Total GLA (sq. Ft)
Number of Units Percentage Leased, Pre-sold
Expected / Actual Completion Date Range
Villarboit Income-producing $10.7 316,000 sq.ft 96.6% NA Bayfjeld LP's Income-producing $14.1 1.15 million sq.ft. 77.7% NA Hotel Pur Income-producing $4.2 242 units 80.4% NA Plaza Development Income-producing $3.8 NA NA NA Villarboit Under-development $57.0 877,000 sq.ft. 21.6% Q3 2018 - Q3 2019 Empire Brampton (Lakeside) Construction $24.2 685 units 100% Q3 2017 Empire Lakeshore (Eau Du Soleil) Construction $65.8 1,285 units 98.5% Q4 2019 - Q2 2020 Axis Condominiums Pre-construction $3.8 572 units 100% 2020 Ivy Condominiums Pre-construction $2.4 253 units 100% 2020 Lakeshore East Pre-construction $11.9 NA NA NA Port Credit Pre-construction $27.4 NA NA NA
Empire, Lakeside Brampton, Ontario Empire | Eau Du Soleil Toronto, Ontario Hotel Pur Quebec City, Quebec Mutual Street Toronto, Ontario
*As at June 30, 2017; IFRS values per Financial Statements
DAT Investor Presentation | 19
Dream Hard Asset Alternatives Trust | Development and Investment Holdings
2183 Lakeshore Blvd. West and Parklawn Road Two-tower condominium development located on prime waterfront in Toronto IFRS Value: $65.8 million* 98.5% pre-sold 1,285 units Projected Completion: 2020 Toronto, ON
*as at June 30, 2017 per Financial Statements
DAT Investor Presentation | 20
Dream Hard Asset Alternatives Trust | Development and Investment Holdings
Brampton, ON Pre-sold: 100%
Projected Completion: Q3, 2017 Empire’s newest master-planned community in Brampton, Ontario features a variety of housing including urban semis, town-homes, semi-detached and detached homes on a 96- acre site.
IFRS Value: $24.2 million
*as at June 30, 2017 per fjnancial statements
DAT Investor Presentation | 21
Joint venture with a consortium of partners Value: $27.4 million 23.25% economic interest 2,500 residential units and 200,000 square feet of retail and commercial space 72 acres of prime waterfront 70 Mississauga Road South, Port Credit, ON Exceptional waterfront property in Port Credit
Dream Hard Asset Alternatives Trust | Development and Investment Holdings
*as at June 30, 2017 per fjnancial statements
DAT Investor Presentation | 22
Value: $11.9 million Joint venture with Dream Unlimited and Great Gulf Resi-
5.3 acre site Potential for over 1 million square feet of density Designated Toronto heritage site Silos to be incorporated into development either through adaptive use or rehabilitation 351 - 369 Lakeshore Blvd. East, Toronto, ON Historic waterfront property on prime downtown Toronto location
*as at June 30, 2017 per fjnancial statements
Dream Hard Asset Alternatives Trust | Development and Investment Holdings
DAT Investor Presentation | 23
Dream Hard Asset Alternatives Trust
Infrastructure and renewable power investments are equity investments with long-term fjnancing, long-term contracts and returns that are generally higher than real estate loans or equity when the equity investment is made prior to development. The renewable power sector is relatively new in Canada, although it has a long history elsewhere in the world.
DAT Investor Presentation | 24
Dream Hard Asset Alternatives Trust | Energy & Infrastructure
Contracts for renewable power are typically with governments or regulated utilities that have high credit ratings and provide for the sale of electricity at a fjxed rate for between 20 and 25 years. Returns are generally higher than real estate loans or equity when the investment is made prior to the operational stage. Operating costs are relatively predictable and the debt is typically limited in recourse to the particular asset and is completely paid ofg over the term of the contract. Complex environmental approval and regulatory process, however, the construction is relatively quick with predictable pricing. Wind and sunshine are free. Low correlation to other fjnancial investments. Demand in Canada is increasingly growing for ‘green’ initiatives.
DAT Investor Presentation | 25
Dream Hard Asset Alternatives Trust | Energy & Infrastructure
Number of Projects Economic Interest Installed Capacity MW Weighted Average Remaining PPA (Years) Commercial opera- tional date Carrying Value Operational Ontario Rooftop Solar 10 100% 3.2 17.5 Q2- 2014 - Q3 2015 $13.6 million United Kingdom Wind 32 91% 2.5 17.4 Q2 2013 - Q3 2016 $16.1 million Nova Scotia Wind 3 80% 10.6 18.3 Q4 2015 $32.9 million Ontario Ground-mount Solar 10 100% 4.8 19.1 Q4 2015 - Q4 2016 $72.9 million Total 21.1 18.2 $135.5 million
As at June 30 2017, per Financial Statements
DAT Investor Presentation | 26
3 of these projects have community or Aboriginal partners and will benefjt from participation in the development and a share in project cash fmows. Projects have a Feed-in-Tarifg (FIT) contract (allows for the sale of power at a fjxed price and a fjxed term of 20 years). ~$136 million of invested and committed equity in solar and wind power projects with a target return on equity of 7% - 10% based
Dream Hard Asset Alternatives Trust | Composition of Existing Capital
Dream Alternatives has a conservative and fmexible balance sheet providing us with ample liquidity to maximize the value of the current investments and pursue future investment opportunities.
*Represents mortgage debt on the co-owned properties with Dream Offjce REIT and the renewable power construction loan. Information is as at March 31, 2017.
in portfolio net asset value
in total assets
Debt to Gross Asset Value*
Million Credit Facility maximum
10 Lower Spadina Toronto, Ontario
DAT Investor Presentation | 27
Dream Hard Asset Alternatives Trust | Potential Future Stabilized Portfolio
While we have been turning over the initial assets, we believe we have im- proved the existing assets, by investing in higher returning assets, such as renewable power, and identifying lending and development activities that are likely to generate higher returns. As the non-income-producing assets are liquidated over time and the pro- ceeds are re-invested, DAT is expected to produce signifjcantly higher current returns. Once we have all of DAT’s assets available for investment, we believe that future returns will be more diversifjed and higher on a risk- adjusted basis. We will continue to maximize returns from current investments through Dream’s core competencies of lending and investing directly in development
come-producing properties. We will continue to seek opportunities in Canadian renewable energy assets. Renewable power investments have typically provided predictable returns at levels that are higher than from income properties. Conservative balance sheet positions us to take advantage of future invest- ment opportunities.
DAT Investor Presentation | 28
Dream Hard Asset Alternatives Trust | Depth and Expertise of Management Team
Michael Cooper CRO, Dream, Portfolio Manager, DAT Lindsay Brand Vice President, Alternative Investments Portfolio Management Joshua Kaufman SVP, Retail & Commercial Development Jason Lester Vice Chair, Development Development Opportunities Adam Reeds VP, Energy & Infrastructure Mikhail Arkaev VP, Energy & Infrastructure Renewable Power Pauline Alimchandani CFO & Executive President, Dream CFO, Dream Alternatives Trust Finance Kim Lefever Senior Manager, Investor Relations Investor Relations
Jay Jiang VP, Strategic Finance
DAT Investor Presentation | 29
Dream Hard Asset Alternatives Trust | Experienced and Diverse Board of Directors
David Kaufman CAIA, Amar Bhalla James Eaton Chair, of the Board
President Weatons Holdings Ltd. Board/Trustee Member - J.C. Clark Ltd., Defyrus
Love Foundation, Canadian Art Foun- dation, John David and Signy Eaton Foundation Founder, President & CEO - Westcourt Capital Corporation Host/Writer/ Contributor – BNN “Alternative Invest- ing”, Financial Post “Alternative Inves- tor”, CBC “Lang & O’Leary Exchange” President Capit Investment Corp. Chair - Carlaw Capital Group CEO - Crescent Logic Chairman - Aston Hill Asset Manage- ment IRC
Trust Board DAT Investor Presentation | 30
President & CEO Dream Unlimited Corp. Board Member – Dream Unlimited Corp., Dream Offjce REIT, Dream Global REIT, Dream Industrial REIT, Atrium Mortgage Invest- ment Corporation
Pauline Alimchandani CPA, CA, CFA Joanne Ferstman CPA, CA Jane Gavan Michael Cooper
CFO Dream Unlimited Corp. Vice President, Research Analyst, Real Estate & REITs
Markets Assurance, Con- sulting & Deals
Coopers Board Member Dream Unlimited Corp., Dream Offjce REIT, Excellon Resources Inc., Aimia Inc., Osisko Mining Corporation President & CEO – Dundee Capital Markets Inc. Vice-Chair, Head of Capital Markets – Dundee Wealth Inc. President Asset Management – Dream Unlimited Corp. CEO – Dream Offjce REIT, Dream Global REIT Board Member – Dream Unlimited Corp., Dream Glob- al REIT
Dream Hard Asset Alternatives Trust Dream Hard Asset Alternatives Trust Michael Cooper Portfolio Manager 416-365-5145 mcooper@dream.ca
Contact Information
Dream Hard Asset Alternatives Trust Kimberly Lefever Senior Manager, Investor Relations 416-365-6339 klefever@dream.ca Dream Hard Asset Alternatives Trust Pauline Alimchandani Chief Financial Offjcer 416-365-5992 palimchandani@dream.ca DAT Investor Presentation | 31
Dream Hard Asset Alternatives Trust
DAT Investor Presentation | 32
Dream Hard Asset Alternatives Trust | Income-Producing Properties
Valhalla Centre Mississauga, ON Sussex Centre Mississauga, ON 219 Laurier Avenue W Ottawa, ON Gateway Business Ctre Victoria, BC Lansdowne Village Kamloops, BC 2810 Matheson Blvd. Mississauga, ON London City Centre London, ON 49 Ontario Street Toronto, ON 10 Lower Spadina Toronto, ON 349 Carlaw Avenue Toronto, ON DAT Investor Presentation | 33
Dream Hard Asset Alternatives Trust | Income-Producing Properties 55 Norfolk St. South Simcoe, ON Wedgewood Plaza Halifax, NS
6501 + 6531 Mississauga Rd. Mississauga, ON 80 Whitehall Drive Markham, ON 125 McDonald St. Regina, SK 363 Maxwell Cres. Regina, SK 1105 Pettigrew Ave. Regina, SK 1640 Broder St. Regina, SK 1802 Stock Road Regina, SK 2190 Industrial Drive Regina, SK DAT Investor Presentation | 34
Dream Hard Asset Alternatives Trust | Lending Portfolio
MMS Enterprises (Empire) Oakville, ON West Vancouver Lands Vancouver, BC Yorkville Toronto, ON Empire Communities Eau Du Soleil Toronto, ON Fairmont Resort Mt Tremblant, QC Korf Properties Saskatchewan Hilldale Gardens Burnaby, BC York Downs Markham, ON DAT Investor Presentation | 35
Dream Hard Asset Alternatives Trust | Development and Investment Holdings
Empire Communities Eau Du Soleil Toronto, ON Empire Communities Lakeside Brampton, ON Mutual Street Development Toronto, ON Great Gulf Residential Lakeshore East Toronto, ON Church Wood Residences Toronto, ON 70 Missississauga Rd South Port Credit, ON Bayfjeld Mill Woods LP Edmonton, AB Bayfjeld Retail (2009) LP Kingston, ON; Winnipeg, MB Hotel PUR* Quebec City, QC DAT Investor Presentation | 36
Dream Hard Asset Alternatives Trust | Development and Investment Holdings
Dream Alternatives Trust has two residential development projects with Empire Communities. The projects include a low-rise residential development in Brampton, Ontario and a two-tower condominium development on Lakeshore Blvd. in Toronto, Ontario. Empire Communities has established a tradition of creating prestigious award-winning homes, new condominiums and communities in the Greater Toronto, Hamilton and Niagara regions, while earning a reputation for outstanding attention to detail and customer service. The company received recognition as Ontario’s 2013 Green Builder of the Year. Empire has built more than 10,000 homes and high-rise condominiums throughout Southern Ontario and the GTA. Empire’s many neighbourhoods include Beyond the Sea, Rain, Eau Du Soleil, the Hub, Lakeside, Wynfjeld, Wyndance, Glow and many others. See www.empirecommunities.com for more information.
DAT Investor Presentation | 37
Dream Hard Asset Alternatives Trust | Development and Investment Holdings
The Bayfjeld LP investments consist of an approximately 20% limited partnership interest in two separate L.P.’s with an investment value of approximately $15 million. The Bayfjeld Retail (2009) L.P.
interest in two shopping centres, one in Kingston, Ontario and the other in Winnipeg, Manitoba. The Bayfjeld Mill Woods LP (together with Bayfjeld Retail 2009 LP) owns approximately 60% of a shopping centre and 100% of an offjce building.
DAT Investor Presentation | 38
Dream Hard Asset Alternatives Trust | Non-IFRS Measures & Forward Looking Information
This presentation may contain forward-looking information within the meaning of applicable securities legislation. Forward-looking information is based on a number of assumptions and is subject to a number of risks and uncertainties, many of which are beyond the Trust’s control, which could cause actual results to difger materially from those that are disclosed in or implied by such forward-looking
limited to general and local economic and business conditions, employment levels, mortgage and interest rates and regulations, regulatory risks, environmental risks, consumer confjdence, the fjnancial condition of tenants and borrowers, local real estate conditions, adverse weather conditions and variability in wind conditions and solar irradiation, reliance on key clients, partners and personnel, the uncertainties of acquisitions and new projects, infmation and competition. All forward-looking information in this presentation speaks as of June 30, 2017. The Trust does not undertake to update any such forward-looking information whether as a result of new information, future events or otherwise. Additional information about these assumptions and risks and uncertainties is disclosed in fjlings with securities regulators fjled
These fjlings are also available at the Trust’s website at www.dreamalternatives.ca.
The Trust’s consolidated fjnancial statements are prepared in accordance with International Financial Reporting Standards (“IFRS”). In this presentation, as a complement to results provided in accordance with IFRS, the Trust discloses and discusses certain non-IFRS fjnancial measures including adjusted funds available for distribution (“AFAD”), annualized AFAD return on net assets, net assets attributable to unitholders of the Trust, debt-to-gross book value, net asset value per unit, and average yield on equity, as well as other measures discussed elsewhere in this release. These non- IFRS measures are not defjned by IFRS, do not have a standardized meaning and may not be comparable with similar measures presented by other issuers. The Trust has presented such non-IFRS measures as Management believes they are relevant measures of
Non-IFRS measures should not be considered as alternatives to net income, total comprehensive income or cash fmows generated from operating activities or comparable metrics determined in accordance with IFRS as indicators of the Trust’s performance, liquidity, cash fmow and profjtability. For a full description of these measures and where applicable a reconciliation to the most directly comparable measure calculated in accordance with IFRS please refer to the “Non-IFRS Measures” in the Trust’s Management’s Discussion and Analysis for the period ended June 30, 2017.
DAT Investor Presentation | 39