Atlas Building Charless Fowlkes Computer Science Department - - PowerPoint PPT Presentation
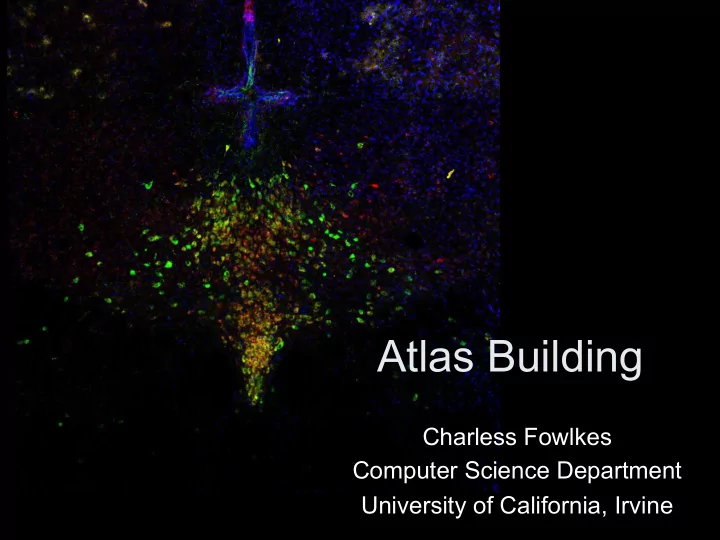
Atlas Building Charless Fowlkes Computer Science Department University of California, Irvine Optical mapping and atlases Improved methods for labeling, clearing and optical imaging place cellular-resolution whole brain acquisition within
Optical mapping and atlases
- Improved methods for labeling, clearing and
- ptical imaging place cellular-resolution
whole brain acquisition within reach even for small labs without titanic resources.
- Computational outlook: need data structures
and algorithms for capturing, curating and querying spatial data
- General types of queries:
– What cell types are present in a particular area? – What other regions do these neurons project to? – Are these two cell populations directly connected?
Allen Mouse Brain Atlas
- Mechanically sectioned, computational registration based on large
scale anatomical features
- Gene expression (in situ) and projection data (rAAV + Cre)
- Very large scale!
Registration and Correspondence
Align data collected across different experiments into a standardized spatio-temporal coordinate system Correspondences between samples is the key:
– Composite / average measurements across experiments – Factor out unimportant modes of spatial variability when making comparisons among individuals – Measure and characterize remaining variability
[Fowlkes, et. al., Cell, 2008]
Drosophila gene expression atlas
Embryo shape and number of cells varies
- D. melanogaster
- D. pseudoobscura
[Fowlkes, et. al., PLoS Genetics, 2011]
How do you represent correspondence and assemble a comprehensive, cellular-resolution description of the brain when the tissue is heterogeneous and there is no simple one-to-one mapping between functionally equivalent circuits?
- 1. What are the
characteristics and functional consequence
- f biological variation?
- 3. How do I find the best
correspondence between samples?
- 2. How should I represent
morphological and other spatio-termporal data?
- 1. Understanding Variability
- What are the modes of variation in spatial
- rganization (cell morphology, genetics, circuits,
activity, development) across individuals?
- How does function depend (or not) on these
differences?
- In what way would we expect comprehensive
maps of the brain to represent individual variation? Does a mean or “typical” connectome make any sense?
- 2. Spatial Representations
- Variability/stochasticity in spatial organization has different
characteristics at different spatio-temporal scales
- How do we represent these different types of information in
a common computational framework? What are the criteria for deciding if we are using the "right” representations?
anatomical shape cell morphology distribution of subcellular components circuit wiring shape-like texture-like ?????
- 3. Robust computational tools
- How do we get quantitative mapping data to interact
computationally with new experimental data collected by individual labs?
- Are atlases only built by specialized, large-scale efforts or
could they be assembled from more heterogeneous data collected by the “long tail” of small labs focused on specific research questions?
- Need robust pipelines for extracting quantitative
morphological descriptions from images and aligning them to
- atlases. Opportunities for user-trainable and human-in-the-