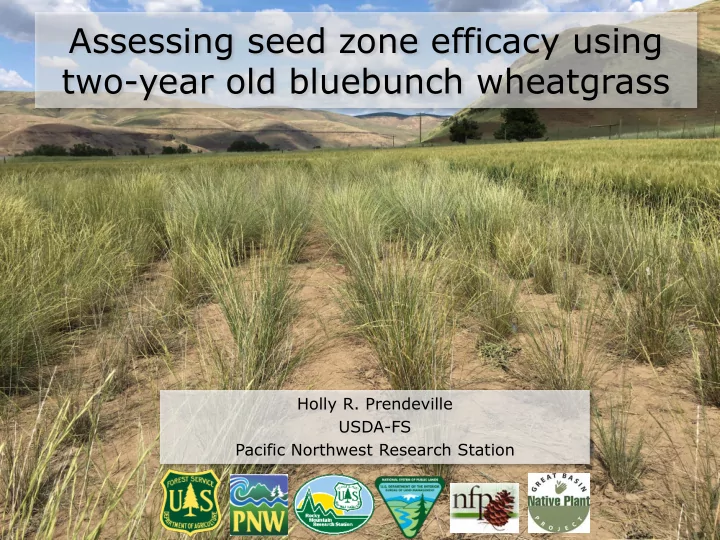

Assessing seed zone efficacy using two-year old bluebunch wheatgrass Holly R. Prendeville USDA-FS Pacific Northwest Research Station
Prairies and shrublands
Invasive and non-native species
Fire
Land of Many Uses
Healthy ecosystems BLM
Provisional seed zone map Minimum winter temperature Aridity Temperature Precipitation Omernik’s Ecoregions level III Bower et al. 2014 Ecol. Appl.
Seed zones Species specific or Empirical seed zones Common gardens Plant traits Morphology Phenology Wild populations Climatic variables Ecoregions level III
Seed zone map for bluebunch wheatgrass 11 zones St. Clair et al. 2013 Evol. Appl.
Bluebunch wheatgrass Pseudoroegneria spicata (PSSP) Post-fire restoration Perennial Habitat range 230 - 2460 m 21 - 187 cm 3 - 11 C
Nancy Shaw Francis Kilkenny Brad St. Clair
SEED ZONES 1 3a 4 5 6a 6b 7b Warmer/Dryer climate (Smaller plants) -> Wetter/Cooler climate (Larger plants) Anatone Goldar Per transect (2=N & S) 7 sites 34 pops + 2 propagated lines
Fall 2014
Fall 2014
Comments / Questions? Data collection 2015 & 2016 hollyrprendeville@fs.fed.us
Successful restoration Survival Growth Reproduction Germination
High survival in Year 1 Reduction in survival in Year 2 100 2015 90 2016 80 70 Percent survival 60 50 40 30 20 10 0 . 2015 2016
Is local best? An example: 1 Local Not Local Propagated lines Plant material: 0.8 Important plant trait 0.6 0.4 0.2 0 N1 N3a N4 N5 N6a N6b N7b S1 S3a S4 S5 S6a S6b S7b Common garden site 1 3a 4 5 6a 6b 7b 1 3a 4 5 6a 6b 7b
Survival differs among sites Site F 14,109 = 37.65 P<0.0001 Plant material source F 2,109 = 2.00 P=0.1406 Site*Source F 28,109 = 0.84 P=0.6950 1.0 Local Not local Propogated Lines 0.8 Proportion survival 0.6 0.4 0.2 0.0 N1 N3a N4 N5 N6a N6b N7b S1 S3a S4 S5 S6a S6b S7b Common garden site 1 3a 4 5 6a 6b 7b 1 3a 4 5 6a 6b 7b
Growth differs plant material source across sites Site F 14,109 = 16.38 P<0.0001 Plant material source F 2,109 = 27.67 P<0.0001 Site*Source F 28,109 = 1.96 P=0.008 70 Local 60 Not local Mean growth Yr1 to Yr2 (cm) Propagated lines 50 40 30 20 10 0 N1 N3a N4 N5 N6a N6b N7b S1 S3a S4 S5 S6a S6b S7b Common garden site 1 3a 4 5 6a 6b 7b 1 3a 4 5 6a 6b 7b
Reproductive stalks produced differs by plant material source across sites Site F 14,108 = 33.10 P<0.0001 Plant material source F 2,108 = 18.70 P<0.0001 Site*Source F 28,108 = 2.92 P<0.0001 225 Mean number of reproductive stalks Local 200 Not local 175 Propagated lines 150 125 100 75 50 25 0 N1 N3a N4 N5 N6a N6b N7b S1 S3a S4 S5 S6a S6b S7b Common garden site 1 3a 4 5 6a 6b 7b 1 3a 4 5 6a 6b 7b
Seed production differs by site and plant material source Site F 7,69 = 18.82 P<0.0001 Plant material source F 7,69 = 17.40 P<0.0001 Site*Source F 7,69 = 1.06 P=0.3991 14 Local Not local Propagated lines Mean number of filled seeds per stalk 12 10 8 6 4 2 0 N1 N3a N4 N5 N6a N6b N7b Common garden sites 1 3a 4 5 6a 6b 7b
Field germination timing varies by site (Time lapse cameras) Site F 6,266 = 134.33 P<0.0001 Plant material source F 2,266 = 1.00 P=0.3682 Site*Source F 10,166 = 2.89 P=0.0019 200 Local 180 March Not local 160 Propagated lines February 140 Days to germination 120 January 100 Zero 1 seedling December 80 60 November 40 20 0 N1 N3a N4 N7b S1 S3a S4 S7b Seed zone 1 3a 4 7b 1 3a 4 7b
Proportion of germination differs by seed source across sites Site F 5,2682 = 13.17 P<0.0001 Plant material source F 2,2682 = 0.63 P=0.5321 Site*Source F 10,2682 = 3.69 P<0.001 0.35 Local Not Local 0.3 Propagated lines Proportion germination 0.25 0.2 0.15 0.1 0.05 0 N1 N3a N4 N7b S1 S3a Site 1 3a 4 7b 1 3a
For successful restoration is local best? Survival No Growth Yes, depending on site Reproduction Yes, depending on site Germination Yes, depending on site
Survival and reproduction data 2015-year 1 2020-year 5 2016-year 2 2030-year 10 2017-year 3* 2040-year 20
Conclusions Preliminary data suggest that using seed zones guidelines should improve restoration success Transplanting seedlings
Private Landowners
Comments / Questions? hollyrprendeville@fs.fed.us
Seed zones on Google maps https://www.fs.fed.us/wwetac/threat- map/TRMSeedZoneMapper.php https://www.fs.fed.us/wwetac/threat-map/TRMSeedZoneMobile.php
Recommend
More recommend