assessing and improving large scale parallel volume
play

Assessing and Improving Large Scale Parallel Volume Rendering on the - PowerPoint PPT Presentation

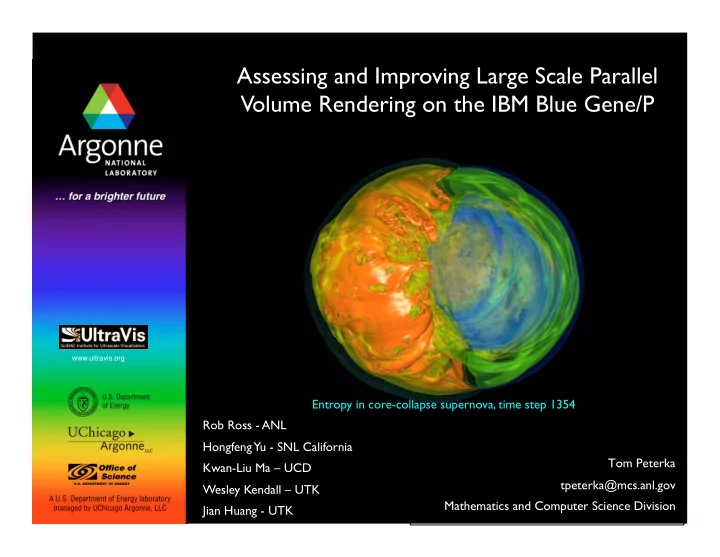
Assessing and Improving Large Scale Parallel Volume Rendering on the IBM Blue Gene/P www.ultravis.org Entropy in core-collapse supernova, time step 1354 Rob Ross - ANL Hongfeng Yu - SNL California Tom Peterka Kwan-Liu Ma


  1. Assessing and Improving Large Scale Parallel Volume Rendering on the IBM Blue Gene/P � www.ultravis.org Entropy in core-collapse supernova, time step 1354 � Rob Ross - ANL � Hongfeng Yu - SNL California � Tom Peterka � Kwan-Liu Ma – UCD � tpeterka@mcs.anl.gov � Wesley Kendall – UTK � Mathematics and Computer Science Division � Jian Huang - UTK �

  2. Leadership Resources � Computation, communication, and storage � Argonne National SC 2008 Ultrascale Visualization Workshop � November 16, 2008 Tom Peterka tpeterka@mcs.anl.gov � 2 � Laboratory

  3. Ever-Increasing Scale of Data and Visualization � Problem sizes are data-dominated. Visualization is no exception. � Computations � Visualizations � Problem size Problem System size Reference (et Dataset (billion Year Dataset size (billion Year PI (CPUs) al.) elements) elements) Lifted H2 air 0.9 2008 Grout Taylor-Raleigh 1.0 128 2001 Kniss Lifted C2 1.3 2008 Grout Molecular H4 air 0.1 256 2006 Childs Dynamics Supernova 1.3 2008 Blondin Earthquake 1.2 2048 2007 Ma Turbulence 8.0 2005 Yeung Supernova 0.6 4096 2008 Peterka Data size Domain PI (TB) Fusion 54.0 Klasky 2008 INCITE Materials 100.0 Wolverton projects � Astrophysics 300.0 Lamb Climate 345.0 Washington Argonne National SC 2008 Ultrascale Visualization Workshop � November 16, 2008 Tom Peterka tpeterka@mcs.anl.gov � 3 � Laboratory

  4. Parallel Volume Rendering � Divide, conquer, and reunite � Argonne National SC 2008 Ultrascale Visualization Workshop � November 16, 2008 Tom Peterka tpeterka@mcs.anl.gov � 4 � Laboratory

  5. Some Parallel Rendering Parameters � Knobs to turn, switches to fl ip, buttons to press � Argument Sample Values DataSize 1120x1120x1120 ImageSize 1600x1600 ImageType ppm, rgb, rgba IP, port 137.72.15.10, 5000 Stereo y, n NumProcs 16384 NumPipes 16 BlockingFactor 8 NumWriters 64 NumThreads 1 Argonne National SC 2008 Ultrascale Visualization Workshop � November 16, 2008 Tom Peterka tpeterka@mcs.anl.gov � 5 � Laboratory

  6. Larger Datasets and Images � Another measure of scalability � Argonne National SC 2008 Ultrascale Visualization Workshop � November 16, 2008 Tom Peterka tpeterka@mcs.anl.gov � 6 � Laboratory

  7. Time Distribution � Reading the data from storage dominates the total cost of a time step. � 1120 3 volume � 1600 2 image � The effect of raw rendering speed is minimal. Hence, s/w rendering rates are acceptable, compared to h/w rendering. The most critical factor is parallel I/O performance, followed by interconnection performance. � Argonne National SC 2008 Ultrascale Visualization Workshop � November 16, 2008 Tom Peterka tpeterka@mcs.anl.gov � 7 � Laboratory

  8. Ef fi ciency � Round robin static block distribution is an inexpensive load balancing scheme that is quite effective. � 1120 3 volume � 1600 2 image � 864 3 volume � 1024 2 image � Argonne National SC 2008 Ultrascale Visualization Workshop � November 16, 2008 Tom Peterka tpeterka@mcs.anl.gov � 8 � Laboratory

  9. Multiple Writers Performance � Improve overall output time by selecting the optimal number of writers. � Memory footprint per core = � 2048 renderers � 70MB + � 2048 compositors � 2.5KB * image size / writing_cores + � 2048 2 image � 4 * volume size / rendering_cores � 64 writers best for most cases; writers need to be distributed among I/O nodes. � Argonne National SC 2008 Ultrascale Visualization Workshop � November 16, 2008 Tom Peterka tpeterka@mcs.anl.gov � 9 � Laboratory

  10. Multithread – MPI Hybrid Programming Model � MPI-pthread rendering � MPI-only I/O and compositing � 1 node � 4 threads � 1 node � 4 procs � 1120 3 volume 1024 2 image � Argonne National SC 2008 Ultrascale Visualization Workshop � November 16, 2008 Tom Peterka tpeterka@mcs.anl.gov � 10 � Laboratory

  11. Multiple Parallel Pipelines � Hide I/O latency by extending concurrency between time steps. � 864 3 volume � 1024 2 image � 6X faster for same total system size when 16 pipelines are used instead of one � Argonne National SC 2008 Ultrascale Visualization Workshop � November 16, 2008 Tom Peterka tpeterka@mcs.anl.gov � 11 � Laboratory

  12. Lessons Learned � and the road ahead � Challenges, to do � Successes � - � Demonstrated scaling � - � Other grid topology � - � Large data and image sizes � - � In situ visualization � - � Improved compositing � - � Adoption into tools � - � Improved and benchmarked I/O � - � Load balancing � - � Other architectures � - � Memory scalability � - � Other vis algorithms � - � Hybrid programming model � - � Parallel pipelines � Argonne National SC 2008 Ultrascale Visualization Workshop � November 16, 2008 Tom Peterka tpeterka@mcs.anl.gov � 12 � Laboratory

  13. Assessing and Improving Large Scale Parallel Volume Rendering on the IBM Blue Gene/P � www.ultravis.org Entropy in core-collapse supernova, time step 1354 � Rob Ross - ANL � Hongfeng Yu - SNL California � Tom Peterka � Kwan-Liu Ma – UCD � tpeterka@mcs.anl.gov � Wesley Kendall – UTK � Mathematics and Computer Science Division � Jian Huang - UTK �

Download Presentation
Download Policy: The content available on the website is offered to you 'AS IS' for your personal information and use only. It cannot be commercialized, licensed, or distributed on other websites without prior consent from the author. To download a presentation, simply click this link. If you encounter any difficulties during the download process, it's possible that the publisher has removed the file from their server.

Recommend


More recommend