
SLIDE 1
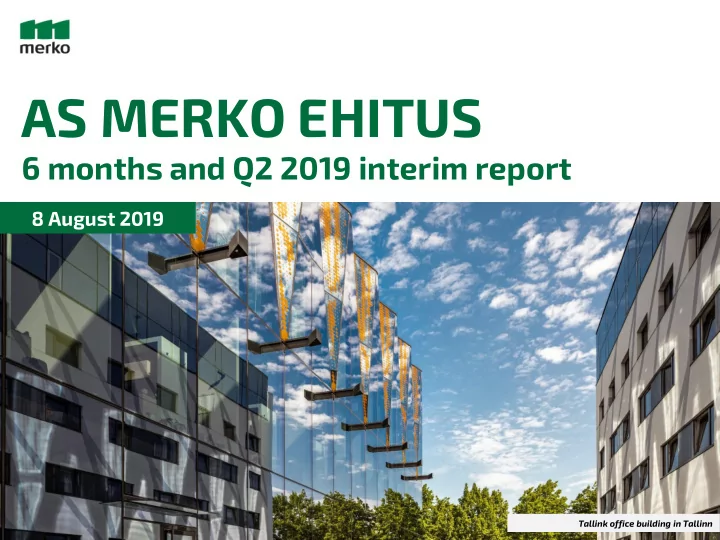
AS MERKO EHITUS
6 months and Q2 2019 interim report
8 August 2019
Tallink office building in Tallinn
AS MERKO EHITUS 6 months and Q2 2019 interim report 8 August 2019 - - PowerPoint PPT Presentation
AS MERKO EHITUS 6 months and Q2 2019 interim report 8 August 2019 Tallink office building in Tallinn Agenda 1. Key Highlights 4. Stock Exchange Overview 2. Business Review 5. Market Outlook 3. Financial Position 6. Strategic Directions 2
8 August 2019
Tallink office building in Tallinn
2
Reconstruction of Neringa hotel in Vilnius
3
❑ Q2 2019 revenue EUR 77m and 6M 2019 EUR 154m, down 16% compared to 6M 2018. Decline was expected: markets are cooling off, secured order book decreased -30% y-o-y (EUR 172m). ❑ More than half of revenue (57%) in 6 months earned outside Estonia; Lithuania and Norway revenues increased. ❑ 2019 Q2 profit before tax EUR 4.5m and 6M EUR 7.5m (increase +6.7%). ❑ 2019 Q2 net profit EUR 1.7m and 6M EUR 4.5m. EUR
❑ In Q2 2019 37 apartments sold and in 6M 100 apartments sold More than 1,000 apartments in total under construction in Estonia, Latvia, Lithuania Will be finished in the end of 2019, but mostly during 2020 ❑ The group continued to implement its long-term apartment development strategy by investing a total of EUR 53m in this field in 6M 2019, including EUR 13m in new land plots
Öpiku building B in Tallinn
4
EUR million
6M 2019 6M 2018 Variance* Q2 2019 Q2 2018 Variance*
Revenue
154.2 183.7
77.4 103.3
EBITDA
8.8 8.2
+7.7%
5.3 6.4
EBITDA margin (%)
5.7 4.4 6.9 6.2
Operating profit
7.6 7.2
+5.5%
4.7 5.9
Operating profit margin (%)
4.9 3.9 6.1 5.8
Profit before tax
7.5 7.1
+6.7%
4.5 5.8
Net profit, attributable to equity holders of the parent
4.5 6.7
1.7 5.6
Earnings per share (EPS), in euros
0.25 0.38
0.09 0.31
Secured order book
172.1 247.0
172.1 247.0
Employees
734 767
734 767
* Variance calculated based on consolidated financial statements of interim reports
❑ The decline in group's revenue due to completion of major projects, general market situation and decline in the secured order book ❑ At the same time, volume of new contracts signed by the group increased by 27% in the first half-year compared to the same period last year ❑ The group focuses on projects where it can generate value added for customers in terms of quality of project management, where pricing is fair and transparent, and contractual risks are distributed in a reasonable manner ❑ In the Baltics, sufficient availability of construction resources (workforce, materials) is still an important topic
5
BUSINESS REVIEW:
EUR million 6M 2019 6M 2018 Variance Q2 2019 Q2 2018 Variance Revenue 154.2 183.6
77.4 103.3
Construction service 142.1 157.4
71.7 86.1
Real estate development 12.1 26.2
5.6 17.2
6
❑ Secured order book EUR 172m (30.06.2018: EUR 247m) ❑ Private sector orders from projects in progress constitute 48% (30.06.2018: 78%) ❑ Total new contracts signed during 6M 2019: EUR 86m (6M 2018: EUR 68m) ❑ Considering the rapid growth of input prices, it is important that there is a good cooperation between the parties of the construction process, and that liability and risk are balanced appropriately
BUSINESS REVIEW:
265 340 54 217 194 247 243 279 256 270 288 388 396 344 292 247 239 229 190 172 100 200 300 400
Q2 2015 Q3 2015 Q4 2015 Q1 2016 Q2 2016 Q3 2016 Q4 2016 Q1 2017 Q2 2017 Q3 2017 Q4 2017 Q1 2018 Q2 2018 Q3 2018 Q4 2018 Q1 2019 Q2 2019
SECURED ORDER BOOK in million euros Secured order book New contracts signed, rolling 12M Construction revenue, rolling 12M New contracts signed, quarter
7
Group’s central business line
❑ 100 apartments, incl. 33 in joint venture, sold in 6M 2019 (6M 2018: 168, incl. 34 in joint venture) ❑ Revenue from sale of own developed apartments EUR 9.2m in 6M 2019 (6M 2018: EUR 16.3m) In addition, there were 403 pre-sale agreements signed as of 30.06.2019 (289 on 30.06.2018) ❑ Construction of 70 apartments launched during 6M 2019 (6M 2018: 349) and EUR 40m invested in apartment developments (6M 2018: EUR 14m) ❑ As of 30.06.2019, 753 apartments on active sale without pre-sale agreements, of which 14% (103 apt.) completed ❑ Land plot portfolio of EUR 67m (30.06.2018: EUR 60m): ➢ Estonia EUR 26m ➢ Latvia EUR 27m ➢ Lithuania EUR 14m
BUSINESS REVIEW:
8
Robust capitalization, good liquidity, moderate debt level
❑ Good liquidity position maintained, cash at EUR 14m as at 30.06.2019 (30.06.2018: EUR 27m). ❑ Net debt amounted to EUR 49m and debt ratio at 22% (30.06.2018: EUR 27m and 19%). Group is self-funding a large proportion of its own development projects construction activities and has not used all its overdraft facilities. ❑ Current assets are at 1.9x current liabilities (30.06.2018: 2.1x). ❑ Equity ratio at 41% (30.06.2018: 43%).
278 290 270 276 288 19,4% 18,5% 16,4% 15,5% 21,8% 30.06.2018 30.09.2018 31.12.2018 31.03.2019 30.06.2019 TOTAL ASSETS AND DEBT TO ASSETS RATIO in million euros / percentages Total assets Debt to assets ratio
40,0 14,0 0,0 0,0 0,0 ( 23,9) ( 1,3) ( 0,8) 31.12.2018 Operating activities CF Investing activities CF Financing activities CF 30.06.2019 CHANGE IN CASH AND CASH EQUIVALENTS in million euros 39,2 27,2 9,5 0,3 0,0 0,1 (0,0) (0,0) (21,9) (0,0) 31.12.2017 Operating activities CF Investing activities CF Financing activities CF Other change 30.06.2018 CHANGE IN CASH AND CASH EQUIVALENTS in million euros
9 6M 2019: 5,580 transactions, turnover EUR 16.9 million (6M 2018: 2,408; EUR 7.7m) 30.06.2019 (30.06.2018): 3,646 shareholders (2,425)
Market Cap as at 30.06.2019: EUR 162m (30.06.2018: EUR 174m)
1,21 1,31 1,26 1,28 1,27 31.12.2015 31.12.2016 31.12.2017 31.12.2018 30.06.2019 P/B RATIO times 15,01 26,17 10,61 8,42 9,47 31.12.2015 31.12.2016 31.12.2017 31.12.2018 30.06.2019 P/E RATIO times Shareholders Number of shares % of total 30.06.2019 % of total 31.03.2019 Variance AS Riverito 12,742,686 71.99% 71.99%
329,602 1.86% 2.01% (26,460) OÜ Midas Invest 264,780 1.50% 1.43% 11,500 Firebird Avrora Fund Ltd 188,927 1.07% 1.22% (26,460) Skandinaviska Enskilda Banken AB, Swedish customers 162,438 0.92% 1.14% (38,562) State Street Bank and Trust Omnibus Account at Fund No OM01 153,018 0.86% 0.91% (7,988) SEB Elu- ja Pensionikindlustus AS 148,787 0.84% 0.84%
145,997 0.83% 0.72% 30,299 Firebird Fund L.P. 114,585 0.65% 0.65% (13,230) Clearstream Banking Luxembourg S.A. clients 105,037 0.59% 0.62% 0,472 Total largest shareholders 14,355,857 81.11% 81.50% 70,429 Total others shareholders 3,344,143 18.89% 18.50% (70,429) Total 17,700,000 100% 100%
❑ In the beginning of 2019, the pace of growth on Estonian and Latvian construction markets has settled down and increased in Lithuania ❑ In Estonia, the boom era peak was exceeded by 13%, while Latvia and Lithuania fell short 17% and 14% respectively ❑ In Estonia, the volumes of building permits issued in the first half of 2019 were essentially on par with the same period the year before ❑ In Lithuania, the volume of issued building permits for residential premises in Q1 halved, permits for non- residential premises was down 15% ❑ Slight decrease in the volume of building permits for residential premises in Latvia, on the other hand, a 2-fold increase in the volume of non-residential building permits ❑ In Norway, a stable growth has improved to 5%, comparing the last 12 months to the same previous period ❑ In Latvia, construction price index growing by ca 5%, in Lithuania above 4% and in Estonia maintaining around 2%. Employment cost component in Estonia ca +5%, in Latvia and Lithuania at times close to even +10%.
Source: Local national statistical offices Source: Local national statistical offices
2 824 1 992 3 101 500 1 000 1 500 2 000 2 500 3 000 3 500 2015 2016 2017 2018 2019 BALTIC STATES CONSTRUCTION MARKETS (WITH OWN FORCES) ROLLING 12 MONTHS in million euros Estonia Latvia Lithuania 2,0 4,7 4,4
2 4 6M 2015 6M 2016 6M 2017 6M 2018 6M 2019 6 MONHTS' CHANGE IN CONSTRUCTION PRICE INDEX percentages Estonia Latvia Lithuania
90 100 110 120 130 140 150 160 2014 2015 2016 2017 2018 2019 NEW AND ALL (dotted line) DWELLINGS QUARTERLY HOUSE PRICE INDEX (4 QUARTER ROLLING AVERAGE) (2013=100) Estonia new Estonia all Latvia new Latvia all Lithuania new Lithuania all
11
Source: Eurostat
❑ Volume of permits for use of residential buildings in Estonia has continued to rise ❑ In Lithuania, volume of permits for use already for couple of years above 2008 peak, certain amount
❑ In Latvia, development volumes compared to Estonia and Lithuania low, although 12 month cumulative annual growth around 10-20% for the past quarters
❑ In Estonia and Lithuania, residential prices continue to
the same for the past year ❑ In all three markets, competition between development projects has increased, buyers’ ability to choose has improved ❑ Success is defined by quality, location and the cohesiveness of the development area ❑ Developers with strong financial capability have an advantage – they can cope successfully with a longer sales period
Construction for clients:
❑ Finalization of large objects and managing risks ❑ Preferred partner for private customers who value reliability and quality ❑ Selective participation in construction tenders. Efficiency of bidding resources. ❑ Internal efficiency and cost savings, incl. with the help of technology. Continue with expanding the usage area of building information modeling (BIM) ❑ Flexibility also to construct smaller objects ❑ Construction tenders for infrastructure facilities
Development of residential real estate:
❑ Selling the best apartments of their price range: to cover different segments. Product development, based on pricing ❑ Continued focus on the capitals of the Baltic states ❑ Integral development concept for large development areas ❑ Launch 650-700 new apartments and invest ca EUR 60m annually, depending on receiving building
launched in 2018 ❑ Ensuring investment capability
12
Viesturdārzs apartment development in Riga
Focus on apartment development and construction activity profitability Focus on current home markets
Revenue 418.0 million euros Net profit 19.3 million euros 764 employees The construction company with the largest equity in the Baltics, long-term capability to self-finance its projects A strong position on the Baltic construction market, the leading residential real estate developer International quality, environmental protection and occupational safety certificates ISO 9001, ISO 14001, OHSAS 18001
SHARES
The shares are listed in the Main List of NASDAQ Tallinn since 1997. The main shareholder is AS Riverito (72%)
2018 KEY FIGURES ESTONIA LATVIA LITHUANIA NORWAY
development and investments
development and investments
development and investments
BUSINESS SEGMENTS AS Merko Ehitus is a construction and real estate development group operating in Estonia, Latvia, Lithuania and Norway
14
AS Merko Ehitus
Delta Plaza, 7th floor Pärnu road 141, 11314 Tallinn, Estonia Phone: +372 650 1250 group.merko.ee
Andres Trink
Chief Executive Officer
Priit Roosimägi
Head of Group Finance Unit
andres.trink@merko.ee priit.roosimagi@merko.ee
➢ This presentation has been prepared by AS Merko Ehitus (the Company) solely for your use and benefit for information purposes only. By accessing, downloading, reading or otherwise making available to yourself any content of the presentation, in whole or in part, you hereby agree to be bound by the following limitations and accept the terms and conditions as set out below. ➢ You are only authorized to view, print and retain a copy of the presentation solely for your own use. No information contained in the presentation may be copied, photocopied, duplicated, reproduced, passed on, redistributed, published, exhibited or the contents otherwise divulged, released or disseminated, directly or indirectly, in whole or in part, in any form by any means and for any purpose to any other person than your directors,
➢ The presentation does not constitute or form part of, and should not be construed as, an offer, solicitation or invitation to subscribe for, underwrite
connection with, any contract to purchase or subscribe for any securities of the Company or any member of its group, nor shall it or any part of it form the basis of or be relied on in connection with any contract or commitment whatsoever. Any person considering the purchase of any securities
solely for your information and background and is subject to amendment. Further, the information in this presentation has been compiled based on information from a number of sources and reflects prevailing conditions as of its date, which are subject to change. ➢ The information contained in this presentation has not been independently verified. The information in this presentation is subject to verification, completion and change without notice and the Company is not under any obligation to update or keep current the information contained herein. Accordingly, no representation or warranty, express or implied, is made or given by or on behalf of the Company or any of its respective members, directors, officers or employees or any other person as to the accuracy, completeness or fairness of the information or opinions contained in this presentation, and any reliance you place on such information or opinions will be at your sole risk. Neither the Company nor any of its respective members, directors, officers or employees nor any other person accepts any liability whatsoever for any loss howsoever arising from any use of this presentation or its contents or otherwise arising in connection therewith. ➢ This presentation includes "forward-looking statements," which include all statements other than statements of historical facts, including, without limitation, any statements preceded by, followed by or that include the words "targets," "believes," "expects," "aims," "intends," "will," "may," "anticipates," "would,“ “plans," "could" or similar expressions or the negative thereof. Such forward-looking statements involve known and unknown risks, uncertainties and other important factors beyond the Company’s control that could cause the actual results, performance or achievements of the Company to be materially different from future results, performance or achievements expressed or implied by such forward-looking
strategies and the environment in which the Company will operate in the future. By their nature, forward-looking statements involve risks and uncertainties because they relate to events and depend on circumstances that may or may not occur in the future. Accordingly, any reliance you place on such forward-looking statements will be at your sole risk. These forward-looking statements speak only as at the date as of which they are made, and neither the Company or any of its respective agents, employees or advisors intends or has any duty or obligation to supplement, amend, update or revise any of the forward-looking statements contained herein to reflect any change in the Company. Past performance of the Company cannot be relied on as a guide to future performance. No statement in this presentation is intended to be a profit forecast.
15