SLIDE 1
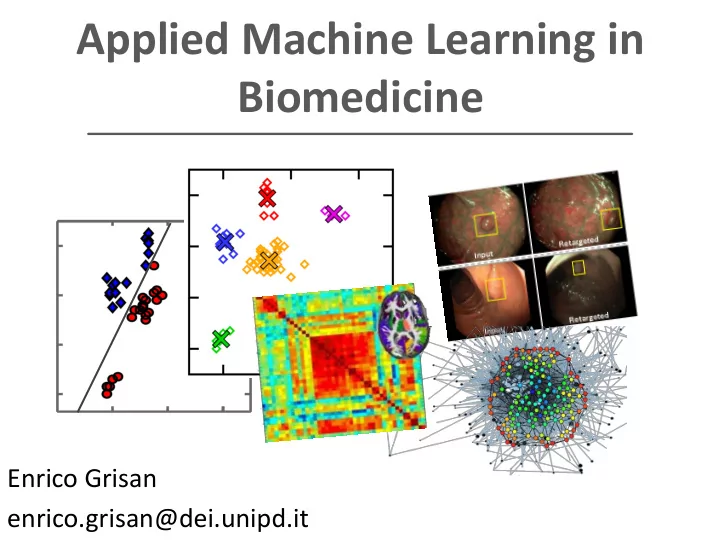
Applied Machine Learning in Biomedicine
Enrico Grisan enrico.grisan@dei.unipd.it
SLIDE 2
Course details
Mon-Wed 10.30-12.00 Room 318 May 4th through May 27th Contact enrico.grisan@dei.unipd.it Exam: project assignment
SLIDE 3
Cancer detection
SLIDE 4
Face detection
How would you detect a face? How does album software tag your frienss?
SLIDE 5
What do we do?
SLIDE 6
What do we do?
SLIDE 7
Speech recognition
SLIDE 8
Brain-coputer interface
SLIDE 9 Recommender systems
Amazon, Netflix, Spotify tell you what you might like
The Netflix Prize was an open competition: predict user ratings for films, based on previous ratings without any other information about the users or films, The grand prize of US$1,000,000 was given to the BellKor's Pragmatic Chaos team which bested Netflix's own algorithm for predicting ratings by 10.06%
SLIDE 10 The age of big data
“Every day, people create the equivalent of 2.5 quintillion bytes of data from sensors, mobile devices, online transactions, and social networks; so much that 90 percent of the world's data has been generated in the past two years..” The Huffington Post: Arnal Dayaratna: IBM Releases Big Data
CERN Collider 320x1012 bytes/s Personal connectome 1018 bytes/person 109 messages/day 30x106 messages/day
SLIDE 11 The role of machine learning
Design and analyze algorithms that
- improve their performance
- at some task
- with experience
Data (experience) Learning algorithm Knowledge (performance on task)
SLIDE 12
Imagenet challenge
SLIDE 13 Kaggle challenge
100 000 $ prize 35000 retinal images 4 DR classes
SLIDE 14
Machine learning in biomedicine
Usually extreme conditions: Very few samples (with respect to the problem) Very large amount of descriptors per sample Very large amount of noise/uncertainty
SLIDE 15 Categories
– Supervised learning
classification, regression
– Unsupervised learning
Density estimation, clustering, dimensionality reduction
– Semisupervised learning – Active learning – Reinforcement learning – …
SLIDE 16 Supervised learning
Feature space Target space Normal Metaplastic Benign neoplastic Malign neoplastic Gene expression Discrete labels Classification CHD risk score Demographic and Clinical data Continuous labels Regression
SLIDE 17 Roadmap
Binary classification
- Parametric and non-parametric prediction
Other supervised settings Principles for learning
SLIDE 18
Oranges and Lemons
SLIDE 19
A two dimensional space
SLIDE 20 Stars and galaxies
Minor elliptical axis (y) against Major elliptical axis (x) for stars (red) and galaxies (blue)
SLIDE 21 Coronoray Heart Disease
Patients with (red) and without (blue) coronary heart disease in South Africa (Rousseauw et al, 1983)
SLIDE 22
Parametric model
SLIDE 23
Linear classifier
SLIDE 24
The weight vector
SLIDE 25
Geometric meaning
SLIDE 26 The weight vector
% ww = Dx1 weights % Xstar = NxD test cases y_pred = sign(Xstar*ww); % Nx1
SLIDE 27 Learning the weights
Rosenblatt’s Perceptron Learning Perceptron criterion: Stochastic gradient descent:
SLIDE 28 Learning the weights
% ww = Dx1 weights % xx = NxD test cases % yy = Nx1 targets (-1,+1)
ww=zeros(D,1); while (~isequal(ww,old_ww))
for ct=1:N, pred=sign(xx(ct,:)*ww); ww=ww+(yy(ct)-pred)*xx(ct,:)’; end; end;
SLIDE 29
Learning the weights
SLIDE 30
Implementing the bias
SLIDE 31
Output of the perceptron
SLIDE 32
SLIDE 33 Linear classifier revisited
If not linearly separable must
- extend model
- add features
SLIDE 34
Nonlinear basis function
SLIDE 35 From model to no model
Faith in previous knowledge Strong assumption on
- data structure
- separating boundary shape
Faith in the data No assumption
the underlying structure Data tell me everything I need
SLIDE 36 K-nearest neighbours classifier
Fix an Hodges 1951
SLIDE 37 Decision boundaries
Linear classification 1-nearest neighbour classifier 15-nearest neighbour classifier
SLIDE 38 Brain MRI application
MICCAI MS lesion challenge 2008 http://www.ia.unc.edu/MSseg/index.html
SLIDE 39
LANDSAT application
SLIDE 40 Identification via gait analysis
Nowlan 2009 Choi 2014
Characterize each person by the way he moves: gait signature
SLIDE 41 Parametric vs non-parametric
- Starting assuming decision boundary is a
plane
- Non-parametric KNN has no fixed assumption:
boundaries gets more complicated with more data
- Non-parametric methods may need more data
and can be computationally intensive
SLIDE 42 Batch supervised learning
Given: example inputs and targets (training set) Task: predicting target for new inputs (test set) Examples:
- classification (binary or multi-class)
- regression
- ordinal regression
- Poisson regression
- ranking
…
SLIDE 43 Batch supervised learning
- Many ways of mapping inputs outputs
- How do we choose what to do?
- How do we know if we are doing well?
SLIDE 44 Algorithm’s objective cost
Formal objective for algorithms:
- minimize a cost function
- maximize an objective function
Proving convergence:
- does objective monotonically improve?
Considering alternatives:
- does another algorithm score better?
SLIDE 45
Loss function
SLIDE 46 Choosing a loss function
- Motivated by the application
– 0-1 error, achieving a tolerance, business cost
- Computational convenience:
– Differentiability, convexity
- Beware of loss dominated by artifacts:
– Outliers – Unbalanced classes