
SLIDE 1
BOSTON PUBLIC SCHOOLS Department Name
Applied Behavioral Analysis (ABA)
BOSTON PUBLIC SCHOOLS Office of Special Education and Student Services
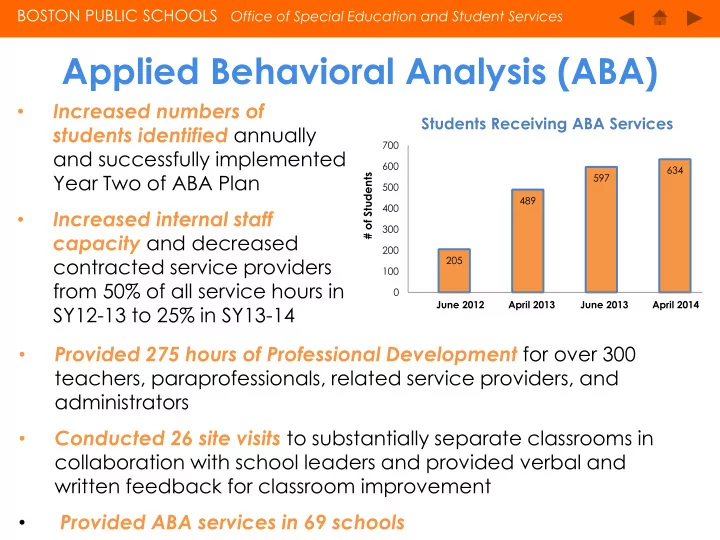
- Increased numbers of
students identified annually and successfully implemented Year Two of ABA Plan
- Increased internal staff
capacity and decreased contracted service providers from 50% of all service hours in SY12-13 to 25% in SY13-14
- Provided 275 hours of Professional Development for over 300
teachers, paraprofessionals, related service providers, and administrators
- Conducted 26 site visits to substantially separate classrooms in
collaboration with school leaders and provided verbal and written feedback for classroom improvement
- Provided ABA services in 69 schools
205 489 597 634 100 200 300 400 500 600 700
# of Students
June 2012 April 2013 June 2013 April 2014
Students Receiving ABA Services