
SLIDE 1
ANNUAL GENERAL MEETING 2018
Sydney 30 October 2018
2
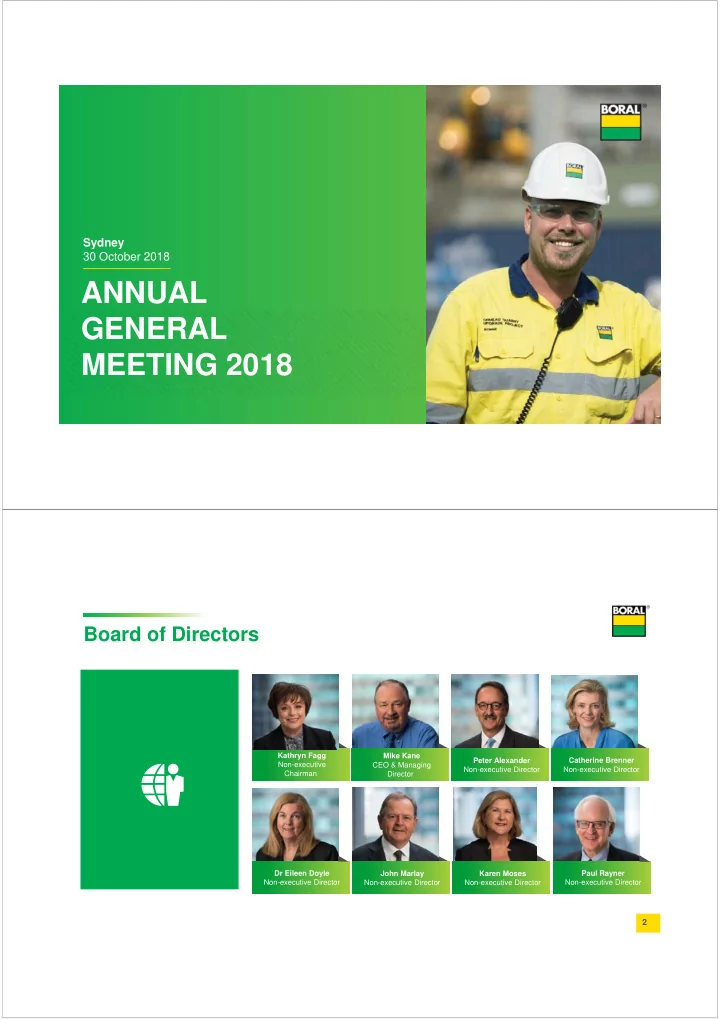
Board of Directors
- Karen Moses
- Non-executive Director
- Mike Kane
- CEO & Managing
Director
- John Marlay
- Non-executive Director
- Dr Eileen Doyle
- Non-executive Director
- Kathryn Fagg
- Non-executive
Chairman
- Peter Alexander
- Non-executive Director
- Catherine Brenner
- Non-executive Director
- Paul Rayner
- Non-executive Director