Announcements Assignment #3 is due on Monday INF 111 / CSE 121: - - PDF document

announcements
SMART_READER_LITE
LIVE PREVIEW

Announcements Assignment #3 is due on Monday INF 111 / CSE 121: - - PDF document

Announcements Assignment #3 is due on Monday INF 111 / CSE 121: Quiz #3 regrades are due today Software Tools and Methods Lecture Notes for Summer, 2008 Michele Rousseau Lecture Note 10 Effort Estimation Lecture Notes 10 - Effort


slide-1
SLIDE 1

1

INF 111 / CSE 121: Software Tools and Methods

Lecture Notes for Summer, 2008 Michele Rousseau Lecture Note 10 – Effort Estimation

Announcements

Assignment #3 is due on Monday Quiz #3 regrades are due today

Lecture Notes 10 - Effort Estimation 2

Previously in INF 111/ CSE 121…

Effort Estimations

  • Better Techniques

Lecture Notes 10 - Effort Estimation 3

Today’s Lecture

Effort Estimation

  • Algorithmic Cost Modeling

◘ COCOMO Personal Software Process (PSP)

Lecture Notes 10 - Effort Estimation 4

( )

Algorithmic Cost Modeling

Cost and development time for a project

is estimated from an equation

Equations can come from research or

industry

A l i f hi t i l d t

Lecture Notes 10 - Effort Estimation 5

  • Analysis of historical data
  • Work best if they are tailored using

personal and organizational data

◘ Adjust weights of metrics based on your environment
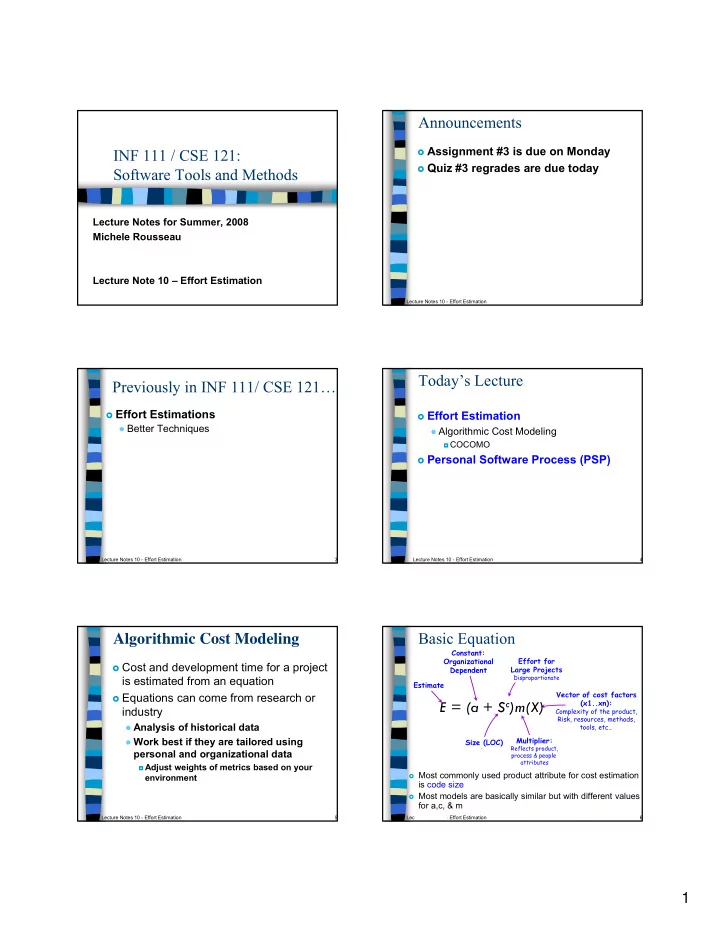
Basic Equation

Vector of cost factors (x1..xn):

Complexity of the product, Risk, resources, methods,

Estimate Constant: Organizational Dependent Effort for Large Projects

Disproportionate

E = (a + Sc)m(X)

Lecture Notes 10 - Effort Estimation 6

Most commonly used product attribute for cost estimation

is code size

Most models are basically similar but with different values

for a,c, & m

tools, etc…

Multiplier:

Reflects product, process & people attributes

Size (LOC)

slide-2
SLIDE 2

2

Problems with Algorithmic Estimation

Effort estimates are based on size

  • Highly inaccurate at start of project
  • Size is usually given in lines of code

Lines of code does not reflect the difficulty

  • Some short programs are harder to write than long ones
  • Lines of code ≠ effort

N t ll ti iti d d

Lecture Notes 10 - Effort Estimation 7

◘ Not all activities produce code

  • Programming Language: Java vs. assembler
  • Number of Components
  • Distribution of the system

Recall Brooks Chapter 2

  • Effort ≠ progress
  • The B exponent is an attempt to account for

communication and complexity costs, but basic problem remains

Estimate Uncertainty

Lecture Notes 10 - Effort Estimation 8

As you approach delivery, the size estimate becomes more accurate

Boehm: COCOMO

Constructive Cost Model (COCOMO)

COCOMO is one of the most widely used software estimation

models in the world

An empirical model based on project experience Well-documented, ‘independent’ model which is not tied to a specific

software vendor

Lecture Notes 10 - Effort Estimation 9 Long history from initial version published in 1981 (COCOMO-81) COCOMO II takes into account different approaches to software

development, reuse, etc.

predicts the effort and schedule for a software product development

based on inputs relating to the size of the software and a number of cost drivers that affect productivity

COCOMO: Some Assumptions

Primary cost driver DSI

  • Delivered Source Instructions (DSI) developed

by the project

  • Only code developed by staff
  • Excludes

Lecture Notes 10 - Effort Estimation 10

◘ Test drivers & other support code ◘ Comments ◘ Declarations ◘ Code developed by application generators

  • SLOC => Single logical line of code eg.

If;then;else

COCOMO: More Assumptions

COCOMO estimates assume that the project will enjoy

good management by both the developer and the customer

Lecture Notes 10 - Effort Estimation 11

Assumes the requirements specification is not

substantially changed after the plans and requirements phase

COCOMO: Three Models

3 Models reflect the complexity:

  • the Basic Model
  • the Intermediate Model

Lecture Notes 10 - Effort Estimation 12

  • and the Detailed Model
slide-3
SLIDE 3

3

The Development Modes: Project Characteristics

Organic Mode

  • developed in a familiar, stable environment,
  • similar to the previously developed projects
  • relatively small and requires little innovation
  • Eg. Payroll system

Semidetached Mode

Lecture Notes 10 - Effort Estimation 13

Semidetached Mode

  • intermediate between Organic and Embedded
  • Eg. Banking System

Embedded Mode

  • tight, inflexible constraints and interface requirements
  • The product requires great innovation
  • Eg. Nuclear power plant system

Basic COCOMO Model:

Estimates the software development effort using only a single predictor variable (size in DSI) and 3 development modes

Lecture Notes 10 - Effort Estimation 14

When Should You Use It ?

  • Good for quick, early, rough order of

magnitude estimates of software costs

Basic COCOMO Model: Equations

Mode Effort Schedule Organic E=2.4*(KDSI)1.05 TDEV=2.5*(E)0.38

Lecture Notes 10 - Effort Estimation 15

Semi- E=3.0*(KDSI)1.12 TDEV=2.5*(E)0.35 detached Embedded E=3.6*(KDSI)1.20 TDEV=2.5*(E)0.32

Basic COCOMO Model: Example

We have determined our project fits the

characteristics of Semi-Detached mode

We estimate our project will have 32,000 Delivered

Source Instructions (DSI).

Lecture Notes 10 - Effort Estimation 16

Using the formulas, we can estimate:

Effort = 3.0*(32) 1.12

= 146 man-months

Schedule = 2.5*(146) 0.35

= 14 months

Productivity

= 32,000 DSI / 146 MM = 219 DSI/MM

Average Staffing

= 146 MM /14 months = 10 FSP

Comparison of Basic Formula

Lecture Notes 10 - Effort Estimation 17

Coefficients derived using actual project data

  • Variability in project characteristics

At best, yield estimates that are at most 25% off, 75%

  • f the time, for projects used to derive the model.

Basic COCOMO Model: Limitations

Its accuracy is necessarily limited

because of its lack of factors which have a significant influence on software costs

Lecture Notes 10 - Effort Estimation 18

costs

Estimates are within a factor of…

  • 1.3 only 29% of the time &
  • 2 only 60% of the time
slide-4
SLIDE 4

4

Take a break!

Get some Coffee Wakey-Wakey

When we return…

More on COCOMO

Lecture Notes 10 - Effort Estimation 19

Intermediate COCOMO Model

Estimates effort by using fifteen cost driver variables besides the size variable used in Basic COCOMO

When should you use it?

Lecture Notes 10 - Effort Estimation 20

y

  • Can be applied across the entire software product

for easy and rough cost estimation during the early stage

  • or it can be applied at the software product

component level for more accurate cost estimation in more detailed stages

Cost Drivers

Four areas for drivers

Product Attributes

  • Reliability, Database Size, Complexity

Computer Attributes

  • Execution Time Constraint, Main Storage Constraint, Virtual

Machine Volatility, Computer Turnaround Time

P l Att ib t

Lecture Notes 10 - Effort Estimation 21

Personnel Attributes

  • Analyst Capability, Applications Experience, Programmer

Capability, Virtual Machine Experience, Programming Language Experience

Project Attributes

  • Modern Programming Practices, Use of Software Tools,

Required Development Schedule

Subjective Assessments

Intermediate Model: Effort Multipliers

Table of Effort Multipliers for each of the

Cost Drivers is provided with ranges depending on the ratings

Lecture Notes 10 - Effort Estimation 22

Cost Driver Very Low Low Nom High Very High Extra High

Product Complexity 0.70 0.85 1.00 1.15 1.30 1.65

Intermediate Model: Equations

Mode Effort Schedule Organic E=EAF*3.2*(KDSI)1.05 TDEV=2.5*(E)0.38

Lecture Notes 10 - Effort Estimation 23

Semi- E=EAF*3.0*(KDSI)1.12 TDEV=2.5*(E)0.35 detached Embedded E=EAF*2.8*(KDSI)1.20 TDEV=2.5*(E)0.32

COCOMO Effort Equation

Effort = 3.0 * EAF * (KSLOC)E

  • Result is in Man-months
  • EAF Effort Adjustment Factor

◘ Derived from Cost Drivers

  • E Exponent

Lecture Notes 10 - Effort Estimation 24

◘ Derived from five scale drivers

  • Precedentedness
  • Development Flexibility
  • Architecture / Risk Resolution
  • Team Cohesion
  • Process Maturity
slide-5
SLIDE 5

5

Intermediate Model: Example

Project A is to be a 32,000 DSI semi-detached

  • software. It is in a mission critical area, so the

reliability is high (RELY=high=1.15).

Then we can estimate:

Effort = 1 15*3 0*(32)1.12

= 167 man-months

Lecture Notes 10 - Effort Estimation 25

Effort = 1.15 3.0 (32)

= 167 man-months

Schedule = 2.5*(167)0.35

= 15 months

Productivity = (DSI / MM)

= 32,000 DSI/167 MM = 192 DSI/MM

Average Staffing =

= 167 MM/15 months MM/Schedule Months = 11 FSP

Intermediate Model: Limitations

Estimates are within 20% of the actuals

68% of the time

Its effort multipliers are phase insensitive

Lecture Notes 10 - Effort Estimation 26

Its effort multipliers are phase-insensitive It can be very tedious to use on a product

with many components

Detailed COCOMO Model: How is it Different?

Phase-sensitive Effort Multipliers

Effort multipliers for the cost drivers are different depending on the software development phases

Lecture Notes 10 - Effort Estimation 27

p p

Module-Subsystem-System Hierarchy

  • The software product is estimated in the three level

hierarchical decomposition.

  • The fifteen cost drivers are related to module or

subsystem level

Detailed COCOMO Model: When Should You Use It?

The Detailed Model can estimate

  • the staffing, cost, and duration of each of the

development phases, subsystems, modules

Lecture Notes 10 - Effort Estimation 28

It allows you to experiment with different

development strategies, to find the plan that best suits your needs and resources

Detailed Model: Equations

Same equations for estimations as the

Intermediate Model

Uses a very complex procedure to calculate

estimation.

Lecture Notes 10 - Effort Estimation 29

  • The procedure uses the DSIs for subsystems

and modules, and module level and subsystem level effort multipliers as inputs

Detailed Model: Limitations

Requires substantially more time and effort

to calculate estimates than previous models

Lecture Notes 10 - Effort Estimation 30

Estimates are within 20% of the actuals

70% of the time

slide-6
SLIDE 6

6

COCOMO II

  • Modified for more current development
  • 3 increasingly detailed cost estimation models

◘ Application composition

  • Prototyping efforts (UI Issues)
  • Used in a powerful CASE environment

◘ Early Design

  • Focused on Architectural design phase

◘ Post-Architecture model

  • Used during implementation phaseCOCOMO estimates assume

Lecture Notes 10 - Effort Estimation 31

U g p p COCO O good mgmt

  • by both the developer and the customer

Assumes the requirements specification is not

substantially changed after the requirements & design phase

  • http://sunset.usc.edu/research/COCOMOII/index.html

So, what can you do?

You

  • Don’t have a historical database
  • Are not an expert

Generate estimates using multiple models and

compare based on your guesses or assumptions

  • Similar to using the models as your personal experts in

Delphi method

Lecture Notes 10 - Effort Estimation 32

Delphi method

  • Candidate models:

◘ Walston and Felix (simple and easy to use) ◘ COCOMO 2 (complicated and detailed) ◘ DeMarco (based on UI requirements) Brooks, p. 20

  • 1/3 planning, 1/6 coding, 1/4 component tests and early

system test, 1/4 system test

Data Collection

Regardless of the method or model

used, data is needed for calibration

Programmers need to know their own

Lecture Notes 10 - Effort Estimation 33

“constant adjustment factors”

  • Goal of Personal Software Process to

establish such a database

Overview of PSP

The Personal Software Process (PSP)

PSP sets out the principal practices for

defining, measuring and analysing an individual’s own processes

Lecture Notes 10 - Effort Estimation 34

The main idea:

  • understand how you work
  • analyze your performance
  • Improve your process
  • Develop an ability to define, measure and analyze

your process

PSP

PSP applies a CMM-like

assessment for individual work

  • Measurement & analysis framework to help

you characterize your process ◘Self-assessment and self-monitoring

Lecture Notes 10 - Effort Estimation 35

g

  • Prescribes a personal process for developing

software

◘ defined steps ◘ Forms ◘ Standards

  • Assumes individual scale & complexity

◘Well-defined individual tasks of short duration

PSP - Steps

1.

Understand the current status of your development process or processes.

2.

Develop a vision of the desired process.

3.

Establish a list of required process improvement actions, in order of priority.

Lecture Notes 10 - Effort Estimation 36

p , p y

4.

Produce a plan to accomplish the required actions.

5.

Commit the resources to execute the plan.

6.

Start over at step 1.

slide-7
SLIDE 7

7

PSP Overview

The PSP is introduced in 7 upward

compatible steps (4 levels)

Write 1 or 2 small programs at each step

  • Assume that you know the programming language

Lecture Notes 10 - Effort Estimation 37

Assume that you know the programming language

Gather and analyze data on your work

  • Many standard forms & spreadsheet templates

Use these analyses to improve your work

  • Note patterns in your work

PSP Evolution

PSP2 PSP3

Cyclic development

PSP2.1 Cyclic Personal Process Personal Quality

Lecture Notes 10 - Effort Estimation 38

PSP0

Current process Time recording Defect recording Defect type standard

PSP1

Size estimating Test report Code reviews Design reviews Design templates

PSP1.1

Task planning Schedule planning

PSP0.1

Coding standard Size measurement Process improvement proposal (PIP)

Baseline Personal Process Q y Management Personal Planning Process

Why use PSP?

demonstrates personal process principles assists engineers in making accurate

plans

determines the steps engineers can take

Lecture Notes 10 - Effort Estimation 39

determines the steps engineers can take

to improve product quality

establishes benchmarks to measure

personal process improvement, and

determines the impact of process changes

  • n an engineer's performance

PSP Evaluation

Humphrey has used in SE courses

  • Improvements in time-to-compile, quality and

productivity

Patchy, but promising use in industry

  • E.g. Nortel (Atlanta)

Lecture Notes 10 - Effort Estimation 40

Still immature Requires large overhead for data

gathering

  • Not clear that you should use permanently or

continually

PSP/TSP/CMM

Lecture Notes 10 - Effort Estimation 41