SLIDE 1 An introduction to the physics of complex networks
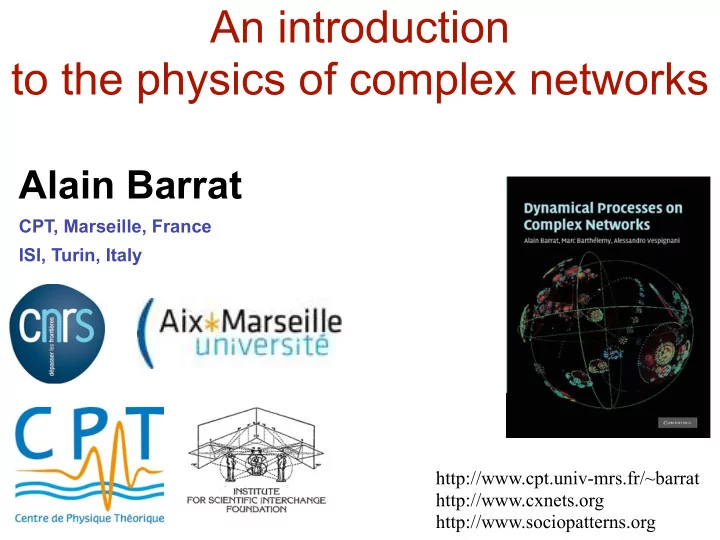
Alain Barrat
CPT, Marseille, France ISI, Turin, Italy
http://www.cpt.univ-mrs.fr/~barrat http://www.cxnets.org http://www.sociopatterns.org
SLIDE 2 REVIEWS:
- Statistical mechanics of complex networks
- R. Albert, A.-L. Barabasi, Reviews of Modern Physics 74, 47 (2002),
cond-mat/0106096
- The structure and function of complex networks
- M. E. J. Newman, SIAM Review 45, 167-256 (2003), cond-mat/
0303516
S.N. Dorogovtsev, J.F.F. Mendes, Adv. Phys. 51, 1079 (2002) , cond- mat/0106144
- Complex Networks: Structure and Dynamics
- S. Boccaletti, V. Latora, Y. Moreno, M. Chavez, D.-U. Hwang,
Physics Reports 424 (2006) 175
SLIDE 3
- Evolution of Networks: From Biological Nets to the
Internet and WWW, S.N. Dorogovtsev and J.F.F.
- Mendes. Oxford University Press, Oxford, 2003.
- Evolution and Structure of the Internet: A Statistical
Physics Approach, R. Pastor-Satorras and A.
- Vespignani. Cambridge University Press, Cambridge,
2004.
- Scale-free networks: Complex Webs in Nature and
Technology, G. Caldarelli. Oxford University Press, Oxford, 2007
SLIDE 4 4
Networks, Crowds, and Markets: Reasoning About a Highly Connected World
Networks, An introduction
SLIDE 5
SLIDE 6
–Definitions –Network statistical characterisation –Empirics
- Models
- Processes on networks
–Resilience –Epidemics
6
SLIDE 7
Can one walk once across each of the seven bridges, come back to the starting point and never cross the same bridge twice?
The bridges of Koenigsberg
SLIDE 8 1735: Leonhard Euler’s theorem: ¡ (a) If a graph has nodes of odd degree, there is no path. ¡ (b) If a graph is connected and has no odd degree nodes, it has at least one path.
Representation of the question as a graph problem
areas = nodes bridges = links
SLIDE 9
Graphs and networks
Graph=set V of nodes joined by links (set E)
very abstract representation very general convenient to represent many different systems
SLIDE 10
Graphs
graph theory abstract tools for the description of graphs (degrees, paths, distances, cliques, etc…)
SLIDE 11 Networks
Nodes: persons computers webpages airports molecules .... Links: social relationships cables hyperlinks air-transportation chemical reactions ....
SLIDE 12 Metabolic Network
Nodes: proteins Links: interactions
Protein Interactions
Nodes: metabolites Links:chemical reactions
SLIDE 14
- M. E. J. Newman and M. Girvan, Physical Review E 69, 026113 (2004).
Image: MEJ Newman, http://www-personal.umich.edu/~mejn/networks/
Scientific collaboration networks
SLIDE 15 Primary school, cumulative contact network
Contact networks
SLIDE 16
World airport network
SLIDE 17 Graph representation different granularities
Internet
SLIDE 18 CAIDA AS cross section map
SLIDE 19
Online (virtual) social networks
SLIDE 20
Networks & Graphs
Networks: of very different origins
Do they have anything in common? Possibility to find common properties? the abstract character of the graph representation and graph theory allow to answer….
SLIDE 21 Interdisciplinary science
Science of complex networks (“Network science”)
- graph theory
- social sciences
- communication science
- biology
- physics
- computer science
Data-driven Tools both from graph theory and outside graph theory
SLIDE 22 Interdisciplinary science
Science of complex networks:
- Empirics
- Characterization
- Modeling
- Dynamical processes
- … and more…
Data-driven Tools both from graph theory and outside graph theory
SLIDE 23 Maximum number of edges
- Undirected: N(N-1)/2
- Directed: N(N-1)
Graph theory: basics
Complete graph:
(all to all interaction/communication)
Graph: G=(V,E) ; |V|=N
SLIDE 24 How to represent a network
- List of nodes + list of edges
i,j
- List of nodes + list of neighbors of each node
(adjacency lists)
1: 2,3,10,... 2: 1,12,11 3: 1,...
SLIDE 25
Adjacency matrix
N nodes i=1,…,N aij=
1 if (i,j) ∈ E 0 if (i,j) ∉ E
0 1 2 3 0 0 1 1 1 1 1 0 1 1 2 1 1 0 1 3 1 1 1 0
3 1 2
SLIDE 26
Adjacency matrix
N nodes i=1,…,N aij=
1 if (i,j) ∈ E 0 if (i,j) ∉ E
0 1 2 3 0 0 1 0 0 1 1 0 1 1 2 0 1 0 1 3 0 1 1 0
3 1 2 Symmetric for undirected networks
SLIDE 27
Adjacency matrix
N nodes i=1,…,N aij=
1 if (i,j) ∈ E 0 if (i,j) ∉ E
0 1 2 3 0 0 1 0 1 1 0 0 0 0 2 0 1 0 0 3 0 1 1 0
3 1 2 Non symmetric for directed networks
SLIDE 28
Matrix of weights
N nodes i=1,…,N wij=
≠ 0 if (i,j) ∈ E 0 if (i,j) ∉ E
0 1 2 3 0 0 2 0 10 1 0 0 0 0 2 0 5 0 0 3 0 1 2 0
3 1 2 (Non symmetric for directed networks)
SLIDE 29
Sparse graphs
Density of a graph D=|E|/(N(N-1)/2)
Number of edges Maximal number of edges D= Sparse graph: D <<1 Sparse adjacency matrix Representation by lists of neighbours of each node (adjacency lists) better suited
SLIDE 30
Node characteristics: Degrees and strengths
SLIDE 31 Node characteristics
- Degree=number of neighbours=∑j aij
i ki=5
NB: in a sparse graph we expect ki << N
0 1 2 3 0 0 1 0 0 1 1 0 1 1 2 0 1 0 1 3 0 1 1 0
3 1 2 i
SLIDE 32 Node characteristics
- Degree in directed graphs:
–in-degree= number of in-neighbours=∑j aji –out-degree= number of out-neighbours=∑j aij 0 1 2 3 0 0 1 0 1 1 0 0 0 0 2 0 1 0 0 3 0 1 1 0
3 1 2
SLIDE 33 Node characteristics
- Weighted graphs: Strength si = ∑j wij
- Directed Weighted graphs:
–in-strength si = ∑j wji –out-strength si = ∑j wij
0 1 2 3 0 0 2 0 10 1 0 0 0 0 2 0 5 0 0 3 0 1 2 0
3 1 2
SLIDE 34 Paths, connectedness, small-world effect
34
SLIDE 35 Paths
G=(V,E) Path of length n = ordered collection of
- n+1 vertices i0,i1,…,in ∈ V
- n edges (i0,i1), (i1,i2)…,(in-1,in) ∈ E
i2 i0 i1 i5 i4 i3 Cycle/loop = closed path (i0=in) Tree=graph with no loops
SLIDE 36 Paths and connectedness
G=(V,E) is connected if and only if there exists a path connecting any two nodes in G
is connected
- is not connected
- is formed by two components
SLIDE 37
Paths and connectedness
G=(V,E)=> distribution of components’ sizes
Giant component= component whose size scales with the number of vertices N Existence of a giant component Macroscopic fraction of the graph is connected
SLIDE 38
Paths and connectedness:
directed graphs
Tube Tendril Tendrils Giant SCC: Strongly Connected Component Giant OUT Component Giant IN Component Disconnected components
Paths are directed
SLIDE 39 Shortest paths
i j Shortest path between i and j: minimum number
distance l(i,j)=minimum number of edges traversed
Diameter of the graph= max(l(i,j)) Average shortest path= ∑ij l(i,j)/(N(N-1)/2)
Complete graph: l(i,j)=1 for all i,j “Small-world”: “small” diameter
SLIDE 40
Ranking nodes
SLIDE 41 Centrality measures
How to quantify the importance of a node?
- Degree=number of neighbours=∑j aij
- Large degree nodes=”hubs”
- Nodes with very large degree can be
“peripheral”
i ki=5
SLIDE 42 Path-based centrality measures
Quantifies the reachability of other nodes from i
gi= 1 / ∑j l(i,j)
SLIDE 43 Betweenness centrality
for each pair of nodes (l,m) in the graph, there are σlm shortest paths between l and m σilm shortest paths going through i bi is the sum of σilm / σlm over all pairs (l,m)
i j
bi is large bj is small NB: similar quantity= load li=∑ σilm NB: generalization to edge betweenness centrality
path-based quantity
SLIDE 44
Betweenness centrality
path-based quantity => bc(i) depends on all the nodes that are connected to i by at least one path
non-local quantity “hard” to compute
“naive” algorithm: O(N3) Brandes algorithm: O(N*E)
SLIDE 45 Local structures; subgraphs; communities
45
SLIDE 46 Structure of neighborhoods
C(i) =
# of links between 1,2,…n neighbors k(k-1)/2 1 2 3 k
Clustering: My friends will know each other with high probability! (typical example: social networks)
Clustering coefficient of a node i
SLIDE 47 Subgraphs
A subgraph of G=(V,E) is a graph G’=(V’,E’) such that V’ ⊆ V and E’ ⊆ E i.e., V’ and E’ are subsets of nodes and edges of G Special case: subgraph induced by a set of nodes=
- this set of nodes
- and all links of G between these nodes
Particular subgraphs=connected components
SLIDE 48
Cliques
A clique is a set C of nodes of G=(V,E) such that for all i,j ∊ C, (i,j)∊ E Examples:
SLIDE 49
Communities: (loose) definition
Group of nodes that are more tightly linked together than with the rest of the graph
SLIDE 50
Communities: examples
SLIDE 51
Communities: examples Scientist collaboration network (Santa Fe Institute)
SLIDE 52
Communities: examples Protein-protein interaction network
SLIDE 53
Why are communities interesting?
Node classification, prediction of unknown characteristics/function Discover groups in social networks, bottom-up classification Discover common interests Recommendation systems Understand role of communities in dynamical processes, e.g. spreading or opinion formation mechanisms
SLIDE 54 Group of nodes that are more tightly linked together than with the rest of the graph
- How to (systematically) detect such groups?
- How to partition a graph into communities?
- How to check if it makes sense?
Community detection
SLIDE 55
- Huge literature
- Tricky and much debated issue
- Many algorithms available, most often open source
http://www.cfinder.org/ http://www.oslom.org/ http://www.tp.umu.se/~rosvall/code.html For a review
- S. Fortunato, Phys. Rep. 486, 75-174, 2010
(http://sites.google.com/site/santofortunato/)
Community detection
SLIDE 56
Hierarchies
SLIDE 57
A way to measure hierarchies:
K-core decomposition
graph G=(V,E) –k-core of graph G: maximal subgraph such that for all vertices in this subgraph have degree at least k –vertex i has shell index k iff it belongs to the k-core but not to the (k+1)-core –k-shell: ensemble of all nodes of shell index k
SLIDE 58 Example
shell index 1 shell index 2 shell index 3 1-core 2-core 3-core
SLIDE 59 http://lanet-vi.fi.uba.ar/
NB: role in spreading processes
SLIDE 60 Statistical characterization
60
SLIDE 61 Statistical characterization
Degree distribution
- List of degrees k1,k2,…,kN
Not very useful!
Nk= number of nodes with degree k
P(k)=Nk/N=probability that a randomly chosen node has degree k
P>(k)=probability that a randomly chosen node has degree at least k
k P(k)
1 2 3 4 0.1 0.2 0.3 0.4 0.5 0.6
SLIDE 62
Statistical characterization
Degree distribution P(k)=Nk/N=probability that a randomly chosen node has degree k Average=< k > = ∑i ki/N = ∑k k P(k)=2|E|/N Fluctuations: < k2> - < k > 2 < k2 > = ∑i k2i/N = ∑k k2 P(k) < kn > = ∑k kn P(k) Sparse graphs: < k > << N
SLIDE 63 Topological heterogeneity
Statistical analysis of centrality measures:
P(k)=Nk/N=probability that a randomly chosen node has degree k Two broad classes
- homogeneous networks: light tails
- heterogeneous networks: skewed, heavy tails
SLIDE 64
Topological heterogeneity
Statistical analysis of centrality measures:
Poisson vs. Power-law log-scale linear scale
SLIDE 65
Statistical characterization
Degree correlations P(k): not enough to characterize a network
Large degree nodes tend to connect to large degree nodes Ex: social networks Large degree nodes tend to connect to small degree nodes Ex: technological networks
SLIDE 66 Statistical characterization
Multipoint degree correlations Measure of correlations:
P(k’,k’’,…k(n)|k): conditional probability that a node of degree k is connected to nodes of degree k’, k’’,…
Simplest case:
P(k’|k): conditional probability that a node of degree k is connected to a node of degree k’
- ften inconvenient (statistical fluctuations)
SLIDE 67 Statistical characterization
Multipoint degree correlations Practical measure of correlations:
average degree of nearest neighbors
i k=3 k=7 k=4 k=4
ki=4 knn,i=(3+4+4+7)/4=4.5
SLIDE 68
Statistical characterization
average degree of nearest neighbors
Correlation spectrum:
putting together nodes which have the same degree
class of degree k
SLIDE 69 Statistical characterization
case of random uncorrelated networks
P(k’|k)
- independent of k
- proba that an edge points to a node of degree k’
proportional to k’ itself Punc(k’|k)=k’P(k’)/< k >
number of edges from nodes of degree k’ number of edges from nodes of any degree
SLIDE 70
Empirics
SLIDE 71 Milgram, Psych Today 2, 60 (1967) Dodds et al., Science 301, 827 (2003)
“Six degrees of separation” SMALL-WORLD CHARACTER
Social networks:
Milgram’s experiment
SLIDE 72 72
60000 start nodes 18 targets 384 completed chains
Social networks as small-worlds:
Milgram’s experiment, revisited
Dodds et al., Science 301, 827 (2003) email chains
SLIDE 73 Small-world properties
Average number of nodes within a chemical distance l
Scientific collaborations Internet
SLIDE 74 The intuition behind the small-world effect
versus Tree: number of reachable nodes grows very fast (exponentially) with the distance (local) regular structure: slower growth of the number of reachable nodes (polynomial), because of path redundancy Random networks: often locally tree-like
SLIDE 75
Small-world yet clustered
SLIDE 76 Clustering coefficient
1 2 3 n
Higher probability to be connected
Clustering: My friends will know each other with high probability (typical example: social networks) Redundancy of paths
Empirically: large clustering coefficients
SLIDE 77 Topological heterogeneity
Statistical analysis of centrality measures:
P(k)=Nk/N=probability that a randomly chosen node has degree k Two broad classes
- homogeneous networks: light tails
- heterogeneous networks: skewed, heavy tails
SLIDE 78
Airplane route network
SLIDE 79 CAIDA AS cross section map
SLIDE 80
Topological heterogeneity
Statistical analysis of centrality measures
Broad degree distributions
(often: power-law tails P(k) ∝ k-γ , typically 2< γ <3)
No particular characteristic scale Unbounded fluctuations
Internet
SLIDE 81
Topological heterogeneity
Statistical analysis of centrality measures:
Poisson vs. Power-law log-scale linear scale
SLIDE 82
Consequences
Power-law tails P(k) ∝ k-γ Average=< k > = ∫k P(k)dk Fluctuations < k2 > =∫ k2 P(k) dk ∝ kc3-γ kc=cut-off due to finite-size N → ∞ => diverging degree fluctuations for γ < 3 Level of heterogeneity:
SLIDE 83
Empirical clustering and correlations
non-trivial structures No special scale
SLIDE 84
Other heterogeneity levels
Weights Strengths
SLIDE 85 Main things to (immediately) measure in a network
- Degree distribution
- Distances, average shortest path, diameter
- Clustering coefficient
- (Weights/strengths distributions)
SLIDE 86 Real-world networks characteristics
Most often:
- Small diameter
- Large local cohesiveness (clustering)
- Heterogeneities (broad degree distribution)
- Correlations
- Hierarchies
- Communities
- …
SLIDE 87 Networks and complexity
87
SLIDE 88 Complex networks
Complex is not just “complicated” Cars, airplanes…=> complicated, not complex Complex (no unique definition):
- many interacting units
- no centralized authority, self-organized
- complicated at all scales
- evolving structures
- emerging properties (heavy-tails, hierarchies…)
Examples: Internet, WWW, Social nets, etc…
SLIDE 89
Models
SLIDE 90 The role of models
“All models are wrong, but some are useful”
(George E. P. Box)
SLIDE 91 The role of models
- Generative
- Explanatory
- Null models
SLIDE 92
Erdös-Renyi random graph model (1960)
N points, links with proba p: static random graphs Average number of edges: < E > = pN(N-1)/2 Average degree: < k > = p(N-1) p=< k >/N to have finite average degree as N grows
SLIDE 93 Erdös-Renyi model (1960)
Proba to have a node of degree k=
- connected to k vertices,
- not connected to the other N-k-1
P(k)= CkN-1 pk (1-p)N-k-1 Large N, fixed pN=< k > : Poisson distribution Exponential decay at large k
SLIDE 94
Erdös-Renyi model (1960)
Small clustering: < C > = p =< k > /N Short distances l=log(N)/log(< k >) (number of neighbours at distance d: < k >d ) Poisson degree distribution
SLIDE 96 Degree Report
Results:
Average Degree: 10.010
96
ER model, N=200 p=0.05
SLIDE 97 Clustering Coefficient Metric Report
Parameters:
Network Interpretation: undirected
Results:
Average Clustering Coefficient: 0.052 Total triangles: 182 The Average Clustering Coefficient is the mean value of individual coefficients.
97
ER model, N=200 p=0.05
SLIDE 98 Clustering Coefficient Metric Report
Parameters:
Network Interpretation: undirected
Results:
Average Clustering Coefficient: 0.652 Total triangles: 3688 The Average Clustering Coefficient is the mean value of individual coefficients.
Airlines, N=235 <k>=11
SLIDE 99 Watts-Strogatz model
Watts & Strogatz, Nature 393, 440 (1998)
Motivation:
- random graph: short distances but no clustering
- regular structure: large clustering but large distances
=> how to have both small distances and large clustering?
SLIDE 100 Watts-Strogatz model
Watts & Strogatz, Nature 393, 440 (1998)
1) N nodes arranged in a line/circle 2) Each node is linked to its 2k neighbors on the circle, k clockwise, k anticlockwise 2) Going through each node one after the other, each edge going clockwise is rewired towards a randomly chosen other node with probability p
SLIDE 101 Watts-Strogatz model
Watts & Strogatz, Nature 393, 440 (1998)
N = 1000
- Large clustering coeff.
- Short typical path
N nodes forms a regular lattice. With probability p, each edge is rewired randomly =>Shortcuts
It takes a lot of randomness to ruin the clustering, but a very small amount to overcome locality
BUT: still homogeneous degree distribution
SLIDE 103 Degree Report
Results:
Average Degree: 4.000
103
SLIDE 105 Degree Report
Results:
Average Degree: 11.038
105
SLIDE 106
Topological heterogeneity
Statistical analysis of centrality measures
Broad degree distributions
(often: power-law tails P(k) ∝ k-γ , typically 2< γ <3)
No particular characteristic scale Unbounded fluctuations
Internet
SLIDE 107 Generalized random graphs
Desired degree distribution: P(k)
- Extract a sequence ki of degrees taken from
P(k)
- Assign them to the nodes i=1,…,N
- Connect randomly the nodes together,
according to their given degree
SLIDE 108 Statistical physics approach
Microscopic processes of the many component units Macroscopic statistical and dynamical properties of the system Cooperative phenomena Complex topology Natural outcome of the dynamical evolution
Find microscopic mechanisms
SLIDE 109
Generative mechanisms
SLIDE 110 Example of mechanism:
preferential attachment
(1) The number of nodes (N) is NOT fixed.
Networks continuously expand by the addition of new nodes
Examples: WWW: addition of new documents Citation: publication of new papers
(2) The attachment is NOT uniform.
A node is linked with higher probability to a node that already has a large number of links.
Examples : WWW : new documents link to well known sites (CNN, YAHOO, NewYork Times, etc) Citation : well cited papers are more likely to be cited again
SLIDE 111 (1) GROWTH : At every timestep we add a new
node with m edges (which have to connect to the nodes already present in the system).
(2) PREFERENTIAL ATTACHMENT :
The probability Π that a new node will be connected to node i depends on the connectivity ki of that node A.-L.Barabási, R. Albert, Science 286, 509 (1999)
Example of mechanism:
preferential attachment
SLIDE 113 Degree Report
Results:
Average Degree: 3.988
113
SLIDE 114 Example of mechanism:
preferential attachment
- why linear?
- assumption: new node has full knowledge of nodes’ degrees
- old nodes have larger degrees (=> fitness)
- trivial k-core decomposition (=> add other edge creation mechanisms)
ISSUES:
Result: scale-free degree distribution with exponent 3
SLIDE 115
How to check if preferential attachment is empirically observed?
Tk=a priori probability for a new node to establish a link towards a node of degree k P(k,t-1)=degree distribution of the N(t-1) nodes forming the network at time t-1 => proba to observe the formation of a link to a node of degree k = Tk *N(t-1)*P(k,t-1)
SLIDE 116 How to measure the preferential attachment
Hence: Tk= fraction of links created between t-1 and t that reach nodes of degree k, divided by N(t-1)P(k,t-1) (i.e., number of nodes of degree k at time t-1)
Linear Tk: sign of preferential attachment
Ex of an online social network:
Where does it come from?
SLIDE 117 Another mechanism:
copying model
- a. Introduction of a new vertex
- b. Selection of a vertex
- c. The new vertex copies m links
- f the selected one
- d. Each new link is kept with proba α, rewired
at random with proba 1-α α 1−α Growing network:
SLIDE 118 Probability for a vertex to receive a new link at time t:
- Due to random rewiring: (1-α)/t
- Because it is neighbour of the selected vertex:
kin/(mt) effective preferential attachment, without a priori knowledge of degrees!
Another mechanism:
copying model
SLIDE 119 Copying model
(model for WWW and evolution of genetic networks)
Power-law tail of degree distribution:
SLIDE 120
- Many other proposed mechanisms in the
literature,
=> modeling other attributes: weights, clustering, assortativity, spatial effects…
=> comparison with (large scale) datasets:
- degree distribution
- degree correlations
- clustering properties
- k-core structure
...
SLIDE 121 Model validation:
degree distribution, degree correlations, clustering properties, k-core structure, ...
Level of detail: depends on context/goal of study
- find a very detailed model
- find a model with qualitative similarities
- show the plausibility of a formation mechanism
- generate artificial data
- study the influence of a particular ingredient
- ...
SLIDE 122
Null models
SLIDE 123 What are null models?
- ensemble of instances of randomly built systems
- that preserve some properties of the studied systems
Aim:
- understand which properties of the studied system are simply random, and
which ones denote an underlying mechanism or organizational principle
- compare measures with the known values of a random case
SLIDE 124 Graph null models
- Fixing size (N, E): random (Erdös-Renyi) graph
- Fixing degree sequence: reshuffling/rewiring methods
Original network Rewired network i i j n m m j n rewiring step
- preserves the degree of each node
- destroys topological correlations
SLIDE 125 125
An example: daily cumulated network of face-to-face interactions
Conference (HT09) Museum (SG)
“seems” small-world “seems” not to be a small-world network
SLIDE 126 HT09: June 30th (rewired)
- SG: July 14th (rewired)
- Museum (SG), rewired
Conference (HT09), rewired
SLIDE 127 (non) Small-worldness
Small-world Non small-world