
SLIDE 1
Alaska’s Economic Climate
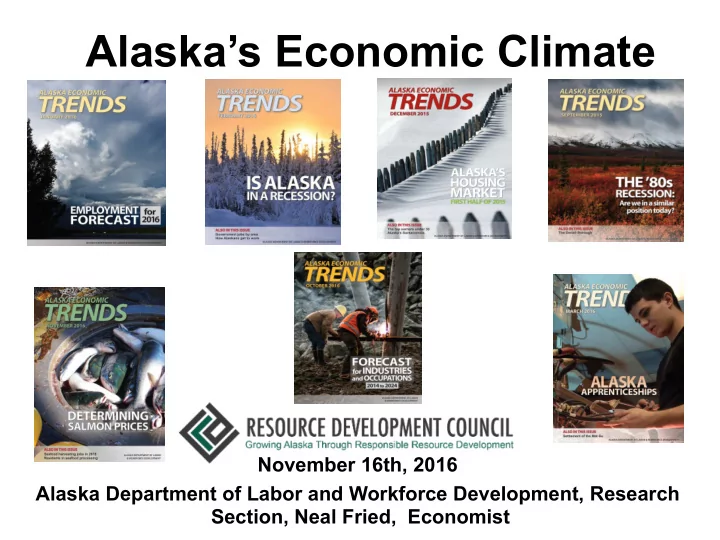
November 16th, 2016 Alaska Department of Labor and Workforce Development, Research Section, Neal Fried, Economist
Alaskas Economic Climate November 16th, 2016 Alaska Department of - - PowerPoint PPT Presentation
Alaskas Economic Climate November 16th, 2016 Alaska Department of Labor and Workforce Development, Research Section, Neal Fried, Economist AlaskaPast Long Term Trends No Longer A Road Map To The Future (basically 27 years of growth)
November 16th, 2016 Alaska Department of Labor and Workforce Development, Research Section, Neal Fried, Economist
160,000 180,000 200,000 220,000 240,000 260,000 280,000 300,000 320,000 340,000
Number of Jobs Oil Revenue Party Alaska’s “Great Recession” 1988-2008, 21 years of growth ends Dropping in 2016 1990 “full recovery” – record annual count begins and goes on for 19 years Lost a few jobs in in 2009
*preliminary
*based on first 6 months
800 400 200 (100)
Total Health Care Federal Gov. Local Gov. Oil and Gas PBS
Number of Jobs Gained and Lost in 2016, first 6 months
ConstrucMon Retail State gov.
$40.3 $44.9 $49.3 $55.4 $50.5 $54.2 $59.3 $61.6 $59.9 $58.1 $52.8
2005 2006 2007 2008 2009 2010 2011 2012 2013 2014 2015
Source:BEA
Declined last 3 quarters--3rd, 4th of 2015 and another 1 percent during first quarter 2016 $ billions
2005 2006 2007 2008 2009 2010 2011 2012 2013 2014 2015 2016*
Source: BEA *based on 2 quarters
$ billions
500 1000 1500 2000 2500
Annual Vacancy Rates 2000 2002 2004 2006 2008 2010 2012 2014 2016 Municipality of Anchorage 4.3% 6.2% 5.2% 6.9% 4.7% 1.8% 2.6% 3.2% 3.8% Fairbanks North Star Borough 8.3% 5.8% 9.9% 12.0% 10.6% 5.0% 8.3% 15.6% 11.2% Juneau Borough 5.0% 3.8% 4.2% 4.9% 5.5% 4.1% 3.2% 3.4% 3.3% Kenai Peninsula Borough 12.3% 5.1% 13.0% 9.4% 8.0% 8.6% 5.5% 6.7% 8.8% Ketchikan Gateway Borough 13.4% 17.8% 7.5% 8.4% 7.1% 12.0% 8.2% 10.4% 9.3% Kodiak Island Borough 7.5% 7.4% 8.2% 5.5% 4.0% 1.3% 2.3% 5.7% 8.0% Matanuska-Susitna Borough 6.2% 3.3% 5.0% 9.3% 5.6% 5.3% 3.5% 5.3% 3.6% Sitka Borough 8.1% 2.9% 4.4% 6.2% 11.9% 7.8% 7.7% 7.2% 8.3% Valdez-Cordova CA 4.8% 8.3% 26.2% 8.6% 7.6% 6.4% 3.1% 3.5% 5.9% Wrangell Borough-Petersburg CA 17.5% 22.1% 8.2% 12.7% 8.8% 4.4% 4.4% 5.6% 9.7% Surveywide 6.6% 6.8% 7.2% 8.2% 6.7% 3.9% 4.4% 6.2% 5.8%
Source: Alaska Department of Labor and Workforce Development, Research and Analysis SecYon and the Alaska Housing Finance CorporaYon; Annual ResidenYal Rental Survey
4% 6% 8% 10% 12%
2005 2006 2007 2008 2009 2010 2011 2012 2013 2014 2015 2016
17,065 17,558 17,037 16,390 15,473 14,869 14,800 15,300
*based on first 9 months of 2016.
22,675 23,141 21,067 24,449 23,195 20,914 22,438 23,004 21,989 20,838
2006 2007 2008 2009 2010 2011 2012 2013 2014 2015
Uniformed military in Alaska
1,650,000 1,700,000 1,750,000 1,800,000 1,850,000 1,900,000 1,950,000 2,000,000
2005-06 2006-07 2007-08 2008-09 2009-10 2010-11 2011-12 2012-13 2013-14 2014-15
Visitors Source: Mcdowell Group
16.3 15.8 17.0 17.5 18.5 17.8 18.4 16.6 17.4 18.4 18.3 17.9 18.3 18.2 18.2
2001 2002 2003 2004 2005 2006 2007 2008 2009 2010 2011 2012 2013 2014 2015
Millions of gallons of beer, wine and liquor consumption in AK
Source: AK Department of Revenue
200 400 600 800 1,000 1,200 1,400 1,600 2000 2001 2002 2003 2004 2005 2006 2007 2008 2009 2010 2011 2012 2013 2014 2015 2016*
*Based on first 6 months-qcew, 113,321,1153
500 1,000 1,500 2,000 2,500 3,000 3,500
2005 2006 2007 2008 2009 2010 2011 2012 2013 2014 2015 2016*
*Based on first 6 months-qcew,
Gold production in thousands of troy ounces, 1900 to 2015 1900 1910 1920 1930 1940 1950 1960 1970 1980 1990 2000 2015
200 400 600 800 1,000 1,200
Source: Alaska Department of Natural Resources, Division of Geological and Geophysical Surveys
400 100
May June Aug Sept Oct Nov Dec Jan Feb Mar April May June July Aug Sept
1985-1987 1991-1997 1998-1999 2001-2003 2015-2016*
2,400
*first 6 months of 2016 compared to same period of 2015
*Total State Government Employment was 24,400 September 2016
Ranking State Median Household Income-2015 1 Maryland $75,847 2 Hawaii $73,486 3 Alaska $73,355 4 New Jersey $72,222 5 Connecticut $71,346 U.S. $55,775
Source: U.S. Census Bureau, ACS,
Annual gains
3,009 8,664 1,131 1,251
2015 = 46,323 moved out, 39,549 moved, in for net loss of -6,774
5,000 10,000 15,000
1984 1985 1986 1987 1988
September, 1986
February, 1986
25 months 13 months 56 months 46 months 26 months 43 months 18 months 18 months 23 months Total Employment Mining ConstrucMon TransportaMon, CommunicaMon and UMliMes Trade Finance, Insurance and Real Estate Services and Miscellaneous State Government Local Government
Jan-84 Jan-85 Jan-86 Jan-87 Jan-88
Tuesday, January 27, 2015
50,000 70,000 90,000 110,000 130,000 150,000 170,000 190,000 210,000 230,000
Number of registered pickups
49,530 snow machines, peaked at 55,249 in 2008