
SLIDE 1
8/24/2012 1
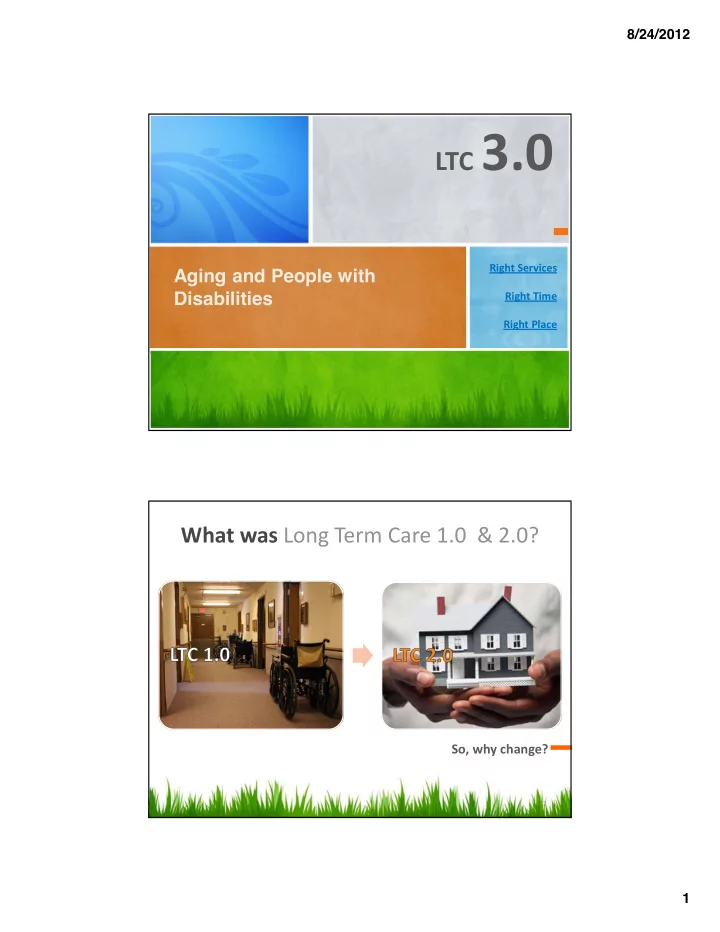
Aging and People with Disabilities
Aging and People with - - PDF document
8/24/2012 Aging and People with Disabilities
8/24/2012 1
Aging and People with Disabilities
8/24/2012 2
8/24/2012 3
65+ Population 200,000 400,000 600,000 800,000 1,000,000 1,200,000 Year 2000 Year 2005 Year 2010 Year 2015 Year 2020 Year 2025 Year 2030 Year 2035 Year 2040 65+ Population
Projected Increase in 65+ Population
(includes Medicaid, SNAP, QMB/SMB/SMF, DD and AMH-eligible individuals)
Actual Increase in Eligibility Related to Disability
8/24/2012 4
Financial Eligibility Clients 100,000 105,000 110,000 115,000 120,000 125,000 130,000 135,000 140,000 145,000 150,000 J ul-05 O c t-05 J an-06 A pr-06 J ul-06 O c t-06 J an-07 A pr-07 J ul-07 O c t-07 J an-08 A pr-08 J ul-08 O c t-08 J an-09 A pr-09 J ul-09 O c t-09 J an-10 A pr-10 J ul-10 O c t-10 J an-11 A pr-11 J ul-11 O c t-11 J an-12 Clients
Actual increase in Eligibility for Benefits
(includes Medicaid, SNAP, QMB/SMB/SMF, DD and AMH-eligible individuals)
Current and projected eligibility for Long Term Services and Supports
8/24/2012 5
– – – – –
8/24/2012 6
– – –
8/24/2012 7
8/24/2012 8
8/24/2012 9
8/24/2012 10
8/24/2012 11
8/24/2012 12
8/24/2012 13
8/24/2012 14
8/24/2012 15
8/24/2012 16