
SLIDE 1
1 CORPORATE PRESENTATION 4Q/ FY 2017 results briefing – 21 February 2018
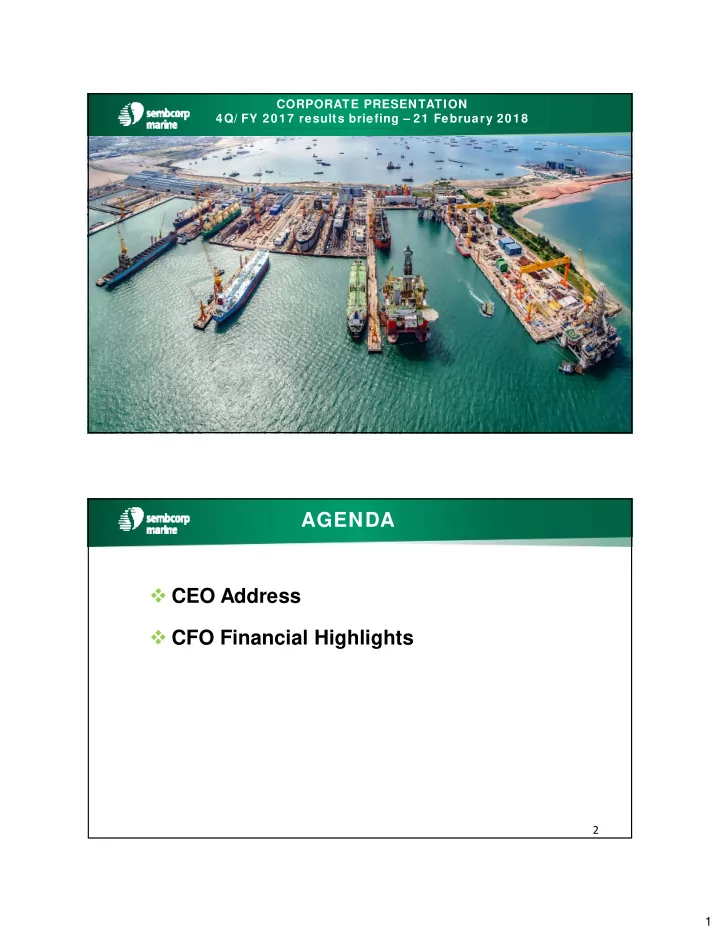
Aerial view of Phase I of Sembcorp Marine Tuas Boulevard Yard
AGENDA CEO Address CFO Financial Highlights 2 1 CEO ADDRESS CEO - - PDF document
CORPORATE PRESENTATION 4Q/ FY 2017 results briefing 21 February 2018 Aerial view of Tuas Boulevard Yard Phase I and II 1 Aerial view of Phase I of Sembcorp Marine Tuas Boulevard Yard AGENDA CEO Address CFO Financial Highlights 2 1
Aerial view of Phase I of Sembcorp Marine Tuas Boulevard Yard
Brent crude - $64.84/bbl
Source: Nasdaq
WTI Nymex $62.03/bbl
Project: Conversion of shuttle tanker to an FPSO, including detailed engineering, installation and integration of topside modules, installation of external turret and power generation, accommodation upgrading as well as extensive piping and electrical cabling works Customer: OOGTK Libra GmbH & Co KG, joint venture between Odebrecht Oil & Gas and Teekay Offshore Delivery: 1Q 2017 Operation: Libra field, Santos Basin, Brazil
Customer: Borr Drilling Delivery: 4Q 2017, 1Q 2018 Contract: Sale of 9 Pacific Class 400 premium jack‐up rigs to Borr Drilling
Project: Engineering and construction of a newbuild semi‐submersible crane vessel Customer: Heerema Offshore Services B.V.
Project: Engineering and construction of a newbuild semi‐submersible crane vessel Customer: Heerema Offshore Services B.V.
Project: Turnkey FSO newbuilding comprising engineering, procurement, construction and commissioning, including installation and integration of turret and topside modules Customer: MODEC Operation: Maersk Oil’s Culzean field, UK North Sea
Project: Engineering, procurement, construction and onshore pre‐commissioning of Central Processing Facility plus 2 connecting bridges, Wellhead Platform and Utilities & Living Quarters Platform Topsides Customer: Maersk Oil North Sea UK Operation: Culzean field, UK North Sea
Field Name Vito Discovery Date Jul-09 Block Mississippi Canyon 984, 985, 940 Reserve Type Oil/Gas Current Status Discovery (Appraised) Production Start FID pending Water Depth 1,282 m / 4,231 ft
33
Turnover ($ million) 4Q 2017 4Q 2016 % change FY 2017 FY 2016 % change Rigs & Floaters 407 496 (18) 1,098 1,887 (42) Repairs & Upgrades 120 110 9 471 460 3 Offshore Platforms 110 200 (45) 732 1,116 (34) Other Activities 18 24 (24) 86 82 5 TOTAL 655 830 (21) 2,387 3,545 (33)
revenue reversal from termination of jack-up rigs with original
for USD1.3 billion. During the year, one of the jack-ups was delivered to Borr Drilling, with 7 scheduled for 2018 and 1 in 2019. 2,295 1,803 670 422
836 980 447 558 586 433 996 1311 69 11
3564 3779 2428 1049 454
2013 2014 2015 2016 2017
REVENUE – RIG BUILDING ($ MILLION)
Drillship SemiSub- drilling, accommodation, well intervention, crane Jack-up, Other rigs
JACK UP RIGS SCHEDULE
1 First rig delivered to Borr Drilling 2017
1 * BOTL/JDC Hakuryu 14
WIP stage 8 * Borr Drilling Jack up rigs 2 - 9
SEMI-SUBMERSIBLE DRILLSHIP SCHEDULE
YTD
4 * Helix semi-well intervention (Q7000) * Heerema Offshore semisub crane vessel * 1st drillship for Transocean, JE III * 2nd drillship for Transocean, JE III
completed stage 1 * Harsh Environment CS60 semi-submersible rig for Seadrill – West Rigel – Agreement to sell for USD500 million Number of projects in suspended state 7 * Drillship 1st unit, Sete Brasil * Drillship 2nd unit, Sete Brasil * Drillship 3rd unit, Sete Brasil * Drillship 4th unit, Sete Brasil * Drillship 5th unit, Sete Brasil * Drillship 6th unit, Sete Brasil * Drillship 7th unit, Sete Brasil
fewer projects being booked. Major deliveries included the FPSO Pioneiro de Libra and the Rangrid FSO for Gina Krog field.
2013 2014 2015 2016 2017
336 428 891 838 644
Offshore conversions
projectsBrief description
2017 2 * FPSO Pioneiro de Libra to OOGTK * Rangrid FSO for Gina Krog field to Teekay
6 * P68 FPSO for Petrobras * P71 FPSO for Petrobras * P68 hull carry over work Stage * FPSO Norte - Kaombo * FPSO Sul - Kaombo
Culzean field
‐ 200 400 600 800 1,000 1,200
2013 2014 2015 2016 2017
Offshore Platforms
projects Brief description
delivered in FY 2017 2 Yamal LNG Batch 3/4 Yamal LNG Batch 5
WIP stage 1 * Maersk Culzean topside modules – for well head platform, central facilities platform and utilities and living quarters platform Number of projects in Planning Stage 1 Tangguh LNG 41
in FY 2017 due to fewer projects on hand. Delivered two projects in FY17.
2013 2014 2015 2016 2017
681 622 557 460 471 REVENUE – REPAIRS & UPGRADES ($ MILLION)
year on year to $471 million on higher revenue per vessel due to improved vessel mix despite fewer vessels repaired in the 12 months.
46
OFFSHORE PLATFORMS 11%
RIGS & FLOATERS 89%
Offshore Platforms 11% Floaters 16% Jackup 3% * Semisubs 13% Drillships 57%
OFFSHORE PLATFORMS 3% RIGS & FLOATERS 97%
Offshore Platforms 3% Floaters 20% Jackup 14% * Semisubs 5% Drillships 58%
* Semisubmersibles include drilling, well intervention, accommodation and crane units