www.afarakgroup.com 16 February 2015 1 Overview Full year Revenue - - PowerPoint PPT Presentation

afarakgroup com 16 february 2015 1 overview full year
SMART_READER_LITE
LIVE PREVIEW

www.afarakgroup.com 16 February 2015 1 Overview Full year Revenue - - PowerPoint PPT Presentation

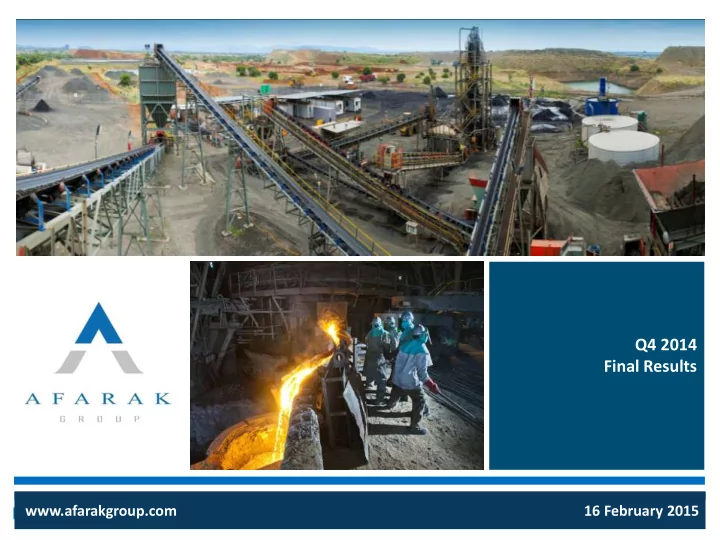
Q4 2014 Final Results www.afarakgroup.com 16 February 2015 1 Overview Full year Revenue increase 27.4% y-o-y Full year EBIT positive of EUR 1.7 million, from EUR -8.0 million in 2013. EBIT first time positive since entering the


slide-1
SLIDE 1

1

16 February 2015 www.afarakgroup.com

Q4 2014 Final Results

slide-2
SLIDE 2

Overview

2

  • Full year Revenue increase 27.4% y-o-y
  • Full year EBIT positive of EUR 1.7 million, from EUR -8.0 million in 2013. EBIT first time positive since entering the

mineral business

  • EBIT negatively effected by EUR 1.6 million due to asset write-downs in our joint venture operation
  • Full year profit positively effected with sale of part of saw mill equipment related to the discontinued operation
  • Increase in sales volumes of 55.4% when compared to the equivalent year 2013
  • Higher demand led to increased processing production in Speciality segment of 23.8%, in the FerroAlloys segment

production also increased by 69.2% as a result of having Mogale in operation throughout the year

  • Mining operations decreased by 38.7% during 2014 were negatively effected due to suspension at Mecklenburg

and strike and lockout at Turkish mines. Mecklenburg and Tavas mines restarted their operation in the last part of Q4 2014

  • The granulation and converter plant at Mogale Alloys was commissioned in December 2014 and allowed the

production of medium carbon ferrochrome, which as from 2015 will affects positively the profitability of Mogale Alloys

  • We expect that the stronger US dollar will improve our profitability is 2015.
  • Proposed capital redemption of EUR 0.02
slide-3
SLIDE 3

Group Financial Performance

3

  • Improvement in full year revenue attributable to increase in sales volumes of processed material in both segments

and growth in trading operations

  • Full year EBITDA decreased mainly due to profit margins remaining low during 2014; the increase in production

cost in both segments; lower revenues from mining operations; a weak US dollar throughout the first three quarters led to lower profitability in both segments; and asset write-downs of EUR1.6M included in the JV share of profit

  • EBITDA in Q4 2014 decreased compared to Q4 2013 to EUR 0.0 (0.8) million. This was mainly due to weaker

profitability on the standard grade material, the increase in production cost; and the JV asset write-downs

  • Cash flow from operations in Q4 was EUR -4.3 (Q4/2013: 2.7) million, Full year was EUR 5.1 (FY/2013: 13.8) million
  • Liquid funds at 31 December were EUR 13.3 (31 December 2013: 13.8) (30 September 2014: 21.4) million

(EUR millions) Q4/14 Q4/13 FY/14 FY/13 Revenue 41.6 41.8 172.7 135.5 EBITDA 0.0 0.8 8.4 14.0 EBITDA margin 0.0% 2.0% 4.9% 10.4% EBIT

  • 1.1
  • 2.8

1.7

  • 8.0

EBIT margin

  • 2.8%
  • 6.8%

1.0%

  • 5.9%

Earnings before taxes

  • 1.3
  • 3.1

0.5

  • 11.2

Earnings margin

  • 3.1%
  • 7.3%

0.3%

  • 8.2%

Profit for continuing operations

  • 0.3
  • 0.7

0.5

  • 4.4

Profit for discontinued operations 1.8 1.8 Profit 1.4

  • 0.7

2.2

  • 4.4
slide-4
SLIDE 4

Sales

4

Processing (tonnes) Q4/14 Q4/13 FY/14 FY/13 Speciality Alloys 5,643 4,989 28,448 21,516 FerroAlloys 17,822 18,604 68,903 41,110 Total 23,465 23,593 97,351 62,626

  • In Q4 the sales from processing, was 23,465 (Q4/2013: 23,593 tonnes, a fractional decrease of 0.5%

compared to the equivalent period in 2013.

  • The Speciality Alloy segment continued the positive trend of 2014, with an increase in sales volumes of

13% when compared to same period in 2013.

  • Sales volumes in the FerroAlloys segment decreased by 4.2%, this was mainly due to lower demand

during Q4 2014 which also affected sales prices which continued to remain weak.

  • Full year sales increased by 55.4% compared to the equivalent period in 2013, this increase was mainly

attributable to the continuing increase in demand in both Speciality Alloys. Last year sales volumes of the FerroAlloys segment were lower as Mogale participation in Eskom’s electricity buyback program.

slide-5
SLIDE 5

Speciality Alloys Production

5

* Mining includes both chromite concentrate and lumpy ore production.

  • Production in Q4 decreased to 9,063 (24,051) tonnes for the fourth quarter 2014, compared to

the equivalent period in 2013.

  • The decrease in production was mainly attributable to the decrease in mining activity of our mines

in Turkey as the lockout continued through the four quarter, processing at EWW increased substantially in Q4 2014 as a result of having the plant closed for shutdown for a shorter period than last year, also daily processing volumes were higher due to increasing demand for specialty alloys material.

  • The annual production decreased by 31.4% to 64,632 (94,230) tonnes. Mining at TMS stopped in

June 2014 following the temporary closure of the mines due to the strike notification. Tavas mine restarted their operation following the end of the lockout in November 2014. Production (tonnes) Q4/14 Q4/13 FY/14 FY/13 Mining* 1,706 19,121 35,848 70,988 Processing 7,357 4,930 28,784 23,242 Total 9,063 24,051 64,632 94,230

slide-6
SLIDE 6

Speciality Alloys Performance

6

  • Revenue in Q4 increase by 14.0% to EUR 22.6 (19.9) million, this was due to higher sales prices

and trading volumes.

  • EBITDA in Q4 increased to EUR 1.2 (0.5) million, we saw a substantial improvement on last year’s

EBITDA.

  • Full year revenue increased by 31.4% to EUR 97.8 (74.5) million, this was mainly due to higher

sales prices and trading volumes of speciality material.

  • EBITDA in Full year decrease to EUR 7.9 (9.0) million, this was due to a weaker US dollar average

rate on conversion of revenue in the first three quarters of 2014; increase in raw material costs; and loss of profit due to the lockout at the mines in Turkey. (EUR millions) Q4/14 Q4/13 FY/14 FY/13 Revenue 22.6 19.9 97.8 74.5 EBITDA 1.2 0.5 7.9 9.0 EBITDA margin 5.2% 2.7% 8.0% 12.1% EBIT 0.8

  • 1.6

5.7

  • 6.1

EBIT margin 3.5%

  • 7.8%

5.8%

  • 8.2%
slide-7
SLIDE 7

Ferroalloys Production

7

*Mining includes both chromite concentrate and lumpy ore production.

  • Production in this segment decreased to 86,434 (145,143) tonnes in the fourth quarter of 2014.
  • This was mainly due to the suspension of the mining operations at Mecklenburg mine, which

restarted mining operations in December 2014.

  • The Stellite mine and Mogale Alloys operated at normal levels during this quarter.
  • The annual production decreased by 27.2% to 341,028 (468,540) tonnes. This decrease was

mainly due to the suspension of mining operation at Mecklenburg mine which led mining production 36.9% down from last year.

Production (tonnes) Q4/14 Q4/13 FY/14 FY/13 Mining* 63,169 133,328 268,351 425,585 Processing 23,265 11,815 72,677 42,955 Total 86,434 145,143 341,028 468,540

slide-8
SLIDE 8

Ferroalloys Performance

8

  • Revenue in Q4 decreased to EUR 19.0 (21.9) million, this was due to lower trading volumes
  • EBITDA in Q4 decreased to EUR -0.4 (0.6) million, this was mainly due to the JV asset write-downs of EURM 1.6
  • Full year revenue increased by 22.6 % to EUR 74.8 (61.0) million, this was driven by the increase in trading

volumes of processed material when compared to 2013

  • Full year EBITDA decreased to EUR 3.1 (8.8) million as a result of lower sales prices; a weak US Dollar rate on

conversion of revenue which only started recover in September 2014; increased cost of production as a result of higher energy cost in the South African winter periods; and a reduction in sales of mining material.

  • Full year EBITDA was negatively affected with joint venture asset write-downs of EUR 1.6 (0.0) million, net

finance expenses of -1.0 (-2.3) million and the depreciation of 0.9 (1.1) million are also included in the joint venture share of profit and affecting our EBITDA

(EUR millions) Q4/14 Q4/13 FY/14 FY/13 Revenue 19.0 21.9 74.8 61.0 EBITDA

  • 0.4

0.6 3.1 8.8 EBITDA margin

  • 1.9%

2.7% 4.1% 14.4% EBIT

  • 1.1
  • 0.9
  • 1.4

2.0 EBIT margin

  • 5.9%
  • 4.2%
  • 1.8%

3.3%

slide-9
SLIDE 9
  • Afarak’s share of joint ventures revenue for Q4 decreased to EUR 0.7 (2.8) million compared to the equivalent

period in 2013, representing a decrease of 76.3%. The decrease in revenue was mainly due to the reduction in sales volumes from the Mecklenburg mine due to the suspended of the mine which only restarted mining

  • peration in December 2014.
  • Share of joint venture EBITDA for Q4 decreased to EUR -2.0 (0.4) million. Decrease in EBITDA was mainly due to

the loss of profitability from Mecklenburg mine material, which also led to higher overhead cost per ton mined as mining volumes decreased by 91.1% when compared to 2013.

  • Share of profit of joint venture was negatively affected by a net write-down in relation to Waylox Mining project
  • f EUR 0.5 (0.0) million as the Company decided not to continue pursuing this project, and a net write-down of

the assets of Stellite mine of EUR 1.1 (0.0) million. (EUR millions) Q4/14 Q4/13 FY/14 FY/13 Revenue 0.7 2.8 5.7 9.5 EBITDA

  • 2.0

0.4

  • 2.2

0.9 EBITDA margin

  • 311.7%

15.8%

  • 38.0%

9.8% EBIT

  • 2.3

0.1

  • 3.1
  • 0.2

EBIT margin

  • 348.4%

4.8%

  • 54.1%
  • 1.8%

Financial income and expense

  • 0.6
  • 0.3
  • 1.0
  • 2.3

Profit for the period

  • 2.2

0.1

  • 3.3
  • 2.3

Ferroalloys Performance – Joint Venture share of profit

9

slide-10
SLIDE 10

Global Market Review

  • The ferrochrome producers had to reduce their prices further for their standard materials, to be able to

compete with the Chinese producers which lowered their prices further during the third quarter of 2014.

  • South African benchmark prices reducing during 2014, producers discounts to the larger buyers have

increased dramatically, where discounts for standard material has increased from 20% earlier in 2014 going up to even 30% from benchmark for charge chrome as the competition in the spot market was tough.

  • The U.S. economy has been strengthening through the second half of 2014, most other regions of the world,

including most of Western Europe and China, have not seen the hoped-for coattails from the stronger U.S. economy helping to strengthen their particular economies, this led the global economy ending 2014 on a downswing with prices for most nonferrous metals decreasing through the second half of the year.

  • It is expected that worldwide production of stainless steel will increase by about 5% worldwide, to reach

approximately 43 million tonnes in 2015.

  • The Group’s speciality ferrochrome production and prices continue to be stable where the superalloy and

speciality stainless steel producers demand was maintained over the fourth quarter.

  • Outlook for 2015 also looks bright with further speciality stainless steel producers committing themselves to

long term agreement to secure tonnages from Afarak Group.

  • Mogale Alloys had its first medium carbon charge chrome production as the converter and granulator was

commissioned in December 2014. First agreements have been signed with major stainless steel producers, and samples have been forwarded to several potential stainless steel customers worldwide.

  • The expectations for 2015 are positive, with production ramping up to full speed by the end of 2015.

10

slide-11
SLIDE 11

Outlook for 2015

  • The global growth in stainless steel production is expected to lead an increase in demand for chrome

products in 2015.

  • As occurred in 2014 where the chrome industry has not been able to increase chrome product prices it

is unclear whether this upswing in prices will occur in 2015.

  • At Mogale Alloys, part of the FerroAlloys division, the Company started production of medium carbon

ferrochrome during the fourth quarter of 2014, this is expected to make a positive contribution towards the Company’s profit margins in 2015.

  • In the Speciality Alloys division Afarak expects to continue to see an increase in raw materials costs.
  • The strengthening of the US dollar is also expected to improve the financial performance of the

Company as compared to 2014.

  • In 2015, Afarak’s revenue is expected to remain at the same levels of 2014 and EBIT is expected to

improve as compared to 2014.

  • Fluctuations of exchange rates between the Euro, the South African Rand, the Turkish Lira and the US

Dollar can significantly impact the Company’s financial performance.

11