
SLIDE 1
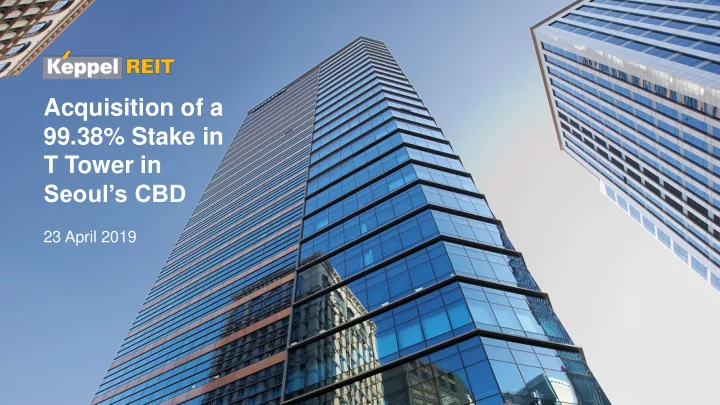
Acquisition of a 99.38% Stake in T Tower in Seoul’s CBD
23 April 2019
Acquisition of a 99.38% Stake in T Tower in Seouls CBD 23 April - - PowerPoint PPT Presentation
Acquisition of a 99.38% Stake in T Tower in Seouls CBD 23 April 2019 Outline Transaction Overview 3 Seoul Office Market 6 Property Highlights 10 Impact to Portfolio 14 IMPORTANT NOTICE: The past performance of Keppel REIT
23 April 2019
2
3
6
10
14
IMPORTANT NOTICE: The past performance of Keppel REIT is not necessarily indicative of its future performance. Certain statements made in this presentation may not be based on historical information or facts and may be “forward-looking” statements due to a number of risks, uncertainties and assumptions. Representative examples of these factors include (without limitation) general industry and economic conditions, interest rate trends, cost of capital and capital availability, competition from similar developments or shifts in expected levels of property rental income, changes in operating expenses, including employee wages, benefits and training, property expenses and governmental and public policy changes, and the continued availability of financing in the amounts and terms necessary to support future business. Prospective investors and unitholders of Keppel REIT (“Unitholders”) are cautioned not to place undue reliance on these forward-looking statements, which are based on the current view of Keppel REIT Management Limited, as manager of Keppel REIT (the “Manager”) on future events. No representation or warranty, express or implied, is made as to, and no reliance should be placed on, the fairness, accuracy, completeness or correctness of the information, or opinions contained in this presentation. None of the Manager, the trustee of Keppel REIT or any of their respective advisors, representatives or agents shall have any responsibility or liability whatsoever (for negligence or otherwise) for any loss howsoever arising from any use of this presentation or its contents or otherwise arising in connection with this presentation. The information set out herein may be subject to updating, completion, revision, verification and amendment and such information may change materially. The value of units in Keppel REIT (“Units”) and the income derived from them may fall as well as rise. Units are not obligations of, deposits in, or guaranteed by, the Manager or any of its affiliates. An investment in Units is subject to investment risks, including the possible loss of the principal amount invested. Investors have no right to request the Manager to redeem their Units while the Units are listed. It is intended that Unitholders may only deal in their Units through trading on Singapore Exchange Securities Trading Limited (“SGX-ST”). Listing of the Units on SGX-ST does not guarantee a liquid market for the Units.
3
▪ Acquiring 99.38%(1) of T Tower, a freehold Grade A office building in Seoul’s central business district (CBD) ▪ Entry into Seoul which has a deep office market with favourable fundamentals ▪ Ability to leverage Keppel Capital’s on-the-ground presence and experience to seek opportunities for growth
T Tower in Seoul’s CBD Land Tenure Freehold Building Completion 2010 Attributable NLA 226,945 sf Occupancy 100% committed WALE 2.8 years
11
(1) The remaining 0.62% stake will be acquired by Keppel Capital Investment Holdings Pte. Ltd., a wholly-owned subsidiary of Keppel Capital Holdings Pte. Ltd. (Keppel Capital)
Click to view property video
4
99.38% of T Tower KRW S$ Independent Valuation by Cushman & Wakefield(1) 259.0b 309.0m Agreed Property Value(1,3) 252.6b 301.4m Transaction Costs(1) 11.5b 13.7m Total Acquisition Consideration(1) 141.1b(4) 168.3m
▪ DPU-accretive acquisition with NPI yield of 4.7% is part of ongoing portfolio optimisation efforts to improve portfolio yield ▪ Agreed property value of KRW 252.6 billion(1,3) (approximately S$301.4 million) is 2.5% lower than independent valuation by Cushman & Wakefield ▪ Acquisition is expected to complete in 2Q 2019 and will be funded by debt, including proceeds from issuance of 1.90% convertible bonds(2)
(1) Based on an approximate 99.38% interest in T Tower and an exchange rate of KRW 1,000 to S$1.193 as at 18 April 2019. (2) As announced by the Manager on 10 April 2019. (3) Equivalent to KRW 20.2 million/pyeong (py), based on attributable gross floor area of 444,979 sf and conversion of 1 py to 35.6 sf. (4) After taking into account the attributable share of the adjusted net tangible liabilities of KRW 123.0 billion (S$146.8 million) to be assumed from the asset.
5
1 Entry into Seoul which has a deep office market with favourable fundamentals 3 DPU-accretive acquisition 4 Geographical and income diversification Freehold Grade A commercial building in the CBD 2 5 Leverage Keppel Capital’s on-the-ground presence and experience in South Korea
T Tower is located in Seoul CBD and near the city’s major railway station, Seoul Station
T Tower: Located in CBD
South Korea Office Transactions(4) (by Buyer Type)
KRW Trillion
7
Economy ▪ South Korea is Asia’s fourth largest economy(1) ▪ The Korean economy is projected to expand by 2.5% in 2019 and 2.6% in 2020(2) ▪ Korean won (KRW) to Singapore dollar (S$) has been trading in a tight band from S$11.25 to S$12.53 per KRW 10,000 over the past 10 years(3) Office Transactions ▪ Seoul had the fourth highest volume of commercial real estate investment globally in 2018(4) ▪ Office investment hit historical high on the back of ample liquidity and quality investment stock, as well as favourable investment sentiment(4)
Sources: (1) IMF, April 2019 (2) Bank of Korea, 18 April 2019 (3) Cushman & Wakefield, 25 March 2019 (4) JLL, 4Q 2018
0.0 2.0 4.0 6.0 8.0 10.0 12.0 14.0 Foreign Domestic
8
Central Business District (CBD): The traditional CBD, a well-established market Gangnam Business District (GBD): Fastest growing of late, newest major market Yeouido Business District (YBD): Government-driven finance hub on an island
Source: JLL
▪ Grade A office buildings will continue to be in high demand across the three business districts(2) ▪ CBD new supply is expected to increase within these 2 years while having limited supply for the subsequent years(2) 3 Key Business Districts in Seoul(1)
200,000 400,000 600,000 800,000 1,000,000 2013 2014 2015 2016 2017 2018 2019F 2020F 2021F 2022F 2023F sqm
Seoul Grade A Office Supply(2)
CBD GBD YBD
Sources: (1) JLL, 4Q 2018 (2) Cushman & Wakefield, 25 March 2019
9
▪ Vacancy rate will peak in 2020 at 16% before lowering to 13% in 2022 with the limited supply for the subsequent years(1)
CBD Supply and Vacancy(1) CBD Effective Rent(1)
KRW per py
50,000 55,000 60,000 65,000 70,000 75,000 80,000 85,000 90,000
2017 2018 2019F 2020F 2021F 2022F sqm %
0.0% 2.0% 4.0% 6.0% 8.0% 10.0% 12.0% 14.0% 16.0% 18.0%
50,000 100,000 150,000 200,000 250,000 300,000
Supply (sqm) Vacancy Rate (%) Supply (sqm)
Source: (1) Cushman & Wakefield, 25 March 2019
T Tower: High Accessibility
11
▪ Located in the CBD, Seoul’s well-established business district ▪ Close to Seoul Station and well-served by various rail, subway and bus networks, including direct connections across the Seoul metropolitan area and regionally via high speed KTX train ▪ Strong connectivity attracts multinational and national companies with regional presence ▪ Sited amidst diverse range of amenities and major hotels, and is close to key retail districts such as Myeong-dong and Namdaemun
Source: JLL
12
▪ Freehold 28-storey office building offering efficient, column-free office space ▪ Close proximity to a wide range of food & beverage outlets and auxiliary retail
Modern lobby Proximity to amenities Pleasant work environment
13
▪ 100% leased to established national and international tenants mainly from the technology, media and telecommunications (TMT), manufacturing and distribution, and services sectors ▪ Notable tenants include: ▪ Philips Korea (country HQ) ▪ LG Electronics ▪ SK Communications ▪ Majority of the leases have fixed annual rental escalations of 3%
Tenant Mix (% of NLA)
33.2% 29.6% 19.8% 11.6% 5.8% Services Manufacturing and distribution Technology, media and telecommunications Government agency Banking, insurance and financial services
T Tower: Complements Existing Portfolio
15
FOR ILLUSTRATIVE PURPOSES ONLY: Pro forma financial effects of the acquisition on DPU
▪ Acquisition of T Tower brings 2.5%(1) DPU accretion on a pro forma basis for FY 2018
Pro Forma Impact of the Acquisition Before
(FY 2018)
After
(Assuming acquisition was completed on 1 January 2018)
DPU 5.56 cents 5.70 cents DPU Accretion +2.5% Pro Forma Impact of the Acquisition Before
(FY 2018)
Before
(Assuming the divestment of a 20% stake in Ocean Financial Centre was completed on 1 January 2018)
After
(Assuming the acquisition of T Tower and the divestment of a 20% stake in Ocean Financial Centre were completed on 1 January 2018)
DPU 5.56 cents 5.44 cents 5.57 cents
(1) Pro forma effect on FY 2018 DPU, assuming acquisition was completed on 1 January 2018.
16
▪ Acquisition will be funded by debt, including proceeds from issuance of 1.90% convertible bonds ▪ Aggregate leverage will increase from 35.7% to approximately 38.1% ▪ Investment will be approximately 50% natural hedged with a KRW denominated loan
(1) The pro forma NAV per Unit as at 31 December 2018, as if the acquisition was completed on 31 December 2018 and after adjusting for 4Q 2018 distribution.
Pro Forma Impact of the Acquisition Before After NAV per Unit(1) S$1.39 S$1.39
FOR ILLUSTRATIVE PURPOSES ONLY: Pro forma financial effects of the acquisition on NAV per Unit
17
Before Acquisition
Owning assets across Singapore, Australia and South Korea enhances income stability of the REIT
After Acquisition
Marina Bay Financial Centre 35.9% Ocean Financial Centre 26.0% One Raffles Quay 9.9% Bugis Junction Towers 8.1% 8 Exhibition Street 5.6% David Malcolm Justice Centre 5.2% 8 Chifley Square 5.0% 275 George Street 4.3%
Country % of Income Singapore 79.9 Australia 20.1 Country % of Income Singapore 75.7 Australia 19.0 South Korea(1) 5.3
Marina Bay Financial Centre 34.0% Ocean Financial Centre 24.7% One Raffles Quay 9.4% Bugis Junction Towers 7.6% 8 Exhibition Street 5.3% David Malcolm Justice Centre 4.9% 8 Chifley Square 4.7% 275 George Street 4.1%
T Tower 5.3%
1Q 2019
S$62.0m
1Q 2019
S$65.4m(1)
(1) For illustrative purposes, assuming the acquisition was completed on 1 January 2019.
18
Before Acquisition
Entry into a third market for potential DPU-accretive acquisitions, in addition to Singapore and Australia
After Acquisition
Marina Bay Financial Centre 37.2% Ocean Financial Centre 26.1% One Raffles Quay 15.8% Bugis Junction Towers 6.4% 8 Exhibition Street 3.2% 8 Chifley Square 2.9% 311 Spencer Street 3.0% 275 George Street 2.8% David Malcolm Justice Centre 2.6%
Country % of AUM Singapore 85.5 Australia 14.5 Country % of AUM Singapore 82.4 Australia 14.0 South Korea(1) 3.6
Marina Bay Financial Centre 35.8% Ocean Financial Centre 25.1% One Raffles Quay 15.3% Bugis Junction Towers 6.2% 8 Exhibition Street 3.1% 311 Spencer Street 2.9% 8 Chifley Square 2.8% 275 George Street 2.7% David Malcolm Justice Centre 2.5%
T Tower 3.6%
As at 31 Mar 2019
S$8.1b
(1) Assuming the acquisition was completed in 1Q 2019. Based on valuation of T Tower by Cushman & Wakefield as at 25 March 2019 and an exchange rate of KRW 1,000 to S$1.193 as at 18 April 2019.
As at 31 Mar 2019
S$8.4b(1)
19
Portfolio Lease Expiry Profile (by committed attributable NLA)
▪ Freehold portion of portfolio increases from 14.9% to 20.6% ▪ Portfolio committed occupancy level rises from 98.7% to 98.8% ▪ Portfolio WALE remains long at approximately 5.5 years while lease expiry remains well spread
2.5% 8.9% 17.6% 21.3% 6.3% 42.2% 0.4% 3.1% 7.1% 0.0% 3.9% 7.2% 2019 2020 2021 2022 2023 2024 and beyond Expiring leases of existing portfolio Rent review leases of existing portfolio
Note: Pro forma data as at 31 March 2019.
0.3%
T Tower leases
3.2% 2.0% 1.3%
20
Australia
Ocean Financial Centre 79.9% Interest Marina Bay Financial Centre 33.3% Interest One Raffles Quay 33.3% Interest Bugis Junction Towers 100% Interest 8 Chifley Square, Sydney 50% Interest 8 Exhibition Street, Melbourne 50% Interest 275 George Street, Brisbane 50% Interest David Malcolm Justice Centre, Perth 50% Interest 311 Spencer Street, Melbourne 50% Interest (Under development)
Note: Based on total assets under management of approximately S$8.4 billion as at 31 March 2019, assuming acquisition of T Tower was completed in 1Q 2019.
Singapore
3.6%
South Korea T Tower, Seoul 99.38% Interest (Pending Completion)
S$8.4b portfolio of 10 prime commercial assets in key business districts of Singapore, Australia and South Korea
Leverage Keppel Capital’s Expertise in South Korea
▪ Keppel Capital has been operating in South Korea since 2004 and has managed various commercial assets in Seoul
▪ Keppel Investment Management, the asset management arm
asset manager for the property ▪ Keppel REIT will be able to leverage Keppel Capital’s experienced team on the ground to seek opportunities for growth in the Seoul office market
Seoul Square Center Place Jongno Tower
21
22
1
Entry into Seoul which has a deep office market with favourable fundamentals
2
Freehold Grade A commercial building in the CBD
3
DPU-accretive acquisition
4
Geographical and income diversification
5
Leverage Keppel Capital’s on-the-ground presence and experience in South Korea