
10/27/18 1
Deborah Walker, PhD & Diana Mason, PhD, ACSF The National Numeracy Network 11:30-12:00, Wells Hall A118 October 13, 2018
Te Texas NS NSA Project
Numeracy Skills Needed for QR Success in General Chemistry
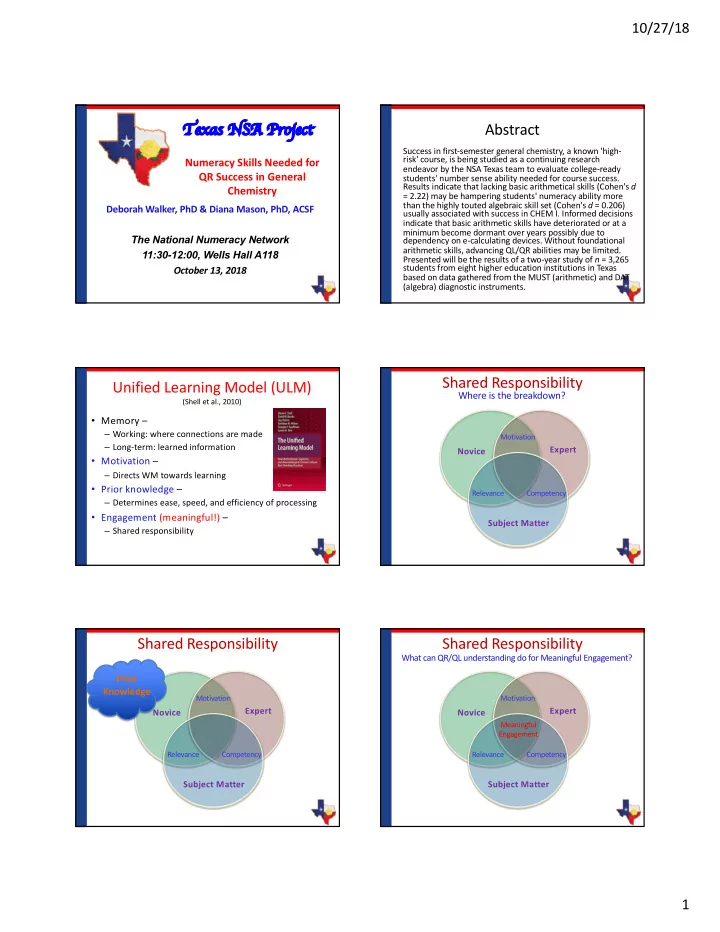
Abstract
Success in first-semester general chemistry, a known 'high- risk' course, is being studied as a continuing research endeavor by the NSA Texas team to evaluate college-ready students' number sense ability needed for course success. Results indicate that lacking basic arithmetical skills (Cohen's d = 2.22) may be hampering students' numeracy ability more than the highly touted algebraic skill set (Cohen's d = 0.206) usually associated with success in CHEM I. Informed decisions indicate that basic arithmetic skills have deteriorated or at a minimum become dormant over years possibly due to dependency on e-calculating devices. Without foundational arithmetic skills, advancing QL/QR abilities may be limited. Presented will be the results of a two-year study of n = 3,265 students from eight higher education institutions in Texas based on data gathered from the MUST (arithmetic) and DAT (algebra) diagnostic instruments.
Unified Learning Model (ULM)
(Shell et al., 2010)- Memory –
– Working: where connections are made – Long-term: learned information
- Motivation –
– Directs WM towards learning
- Prior knowledge –
– Determines ease, speed, and efficiency of processing
- Engagement (meaningful!) –
– Shared responsibility Novice Expert Subject Matter
Motivation Competency RelevanceShared Responsibility
Where is the breakdown?
Novice Expert Subject Matter
Motivation Competency RelevanceShared Responsibility
Prior Knowledge
Novice Expert Subject Matter
Motivation Meaningful Engagement Competency RelevanceShared Responsibility
What can QR/QL understanding do for Meaningful Engagement?