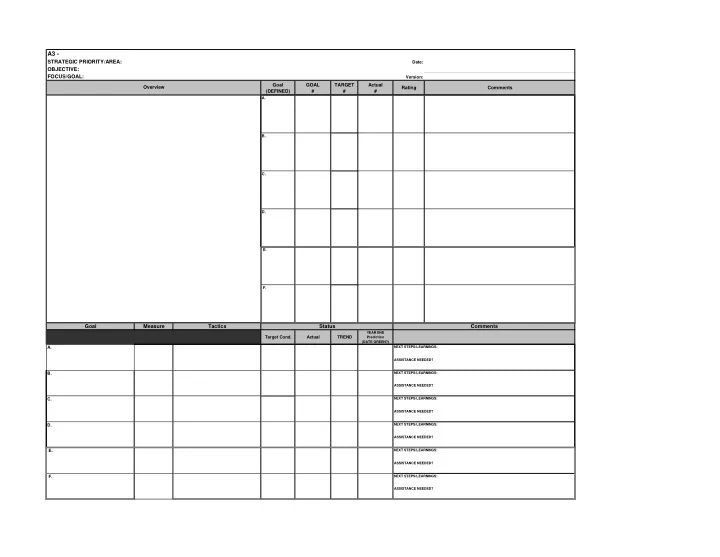
A3 - STRATEGIC PRIORITY/AREA: Date: OBJECTIVE: FOCUS/GOAL: - - PowerPoint PPT Presentation

a3
SMART_READER_LITE
LIVE PREVIEW

A3 - STRATEGIC PRIORITY/AREA: Date: OBJECTIVE: FOCUS/GOAL: - - PowerPoint PPT Presentation

A3 - STRATEGIC PRIORITY/AREA: Date: OBJECTIVE: FOCUS/GOAL: Version: Goal GOAL TARGET Actual Overview Rating Comments (DEFINED) # # # A. B. C. D. E. F. Goal Measure Tactics Status Comments YEAR END Target Cond. Actual


slide-1
SLIDE 1

STRATEGIC PRIORITY/AREA:

Date:

OBJECTIVE: FOCUS/GOAL:

Version: Goal (DEFINED) GOAL # TARGET # Actual # Rating Comments

Goal Measure Tactics

Target Cond. Actual TREND

YEAR END Prediction (DATE GREEN?) ASSISTANCE NEEDED? NEXT STEPS/LEARNINGS: ASSISTANCE NEEDED?

F.

NEXT STEPS/LEARNINGS: NEXT STEPS/LEARNINGS: ASSISTANCE NEEDED?

E. D.

NEXT STEPS/LEARNINGS: ASSISTANCE NEEDED?

B. C.

Status Comments

NEXT STEPS/LEARNINGS: ASSISTANCE NEEDED? NEXT STEPS/LEARNINGS: ASSISTANCE NEEDED?

A. E. F. C. D. B.

A3 -

Overview

A.

slide-2
SLIDE 2

Dept /Service Line Target Condition

Report Writer:

Opportunity / Metric Actual

Last Updated: Countermeasures A

100

B

100

C

100

D

103

E

100

Target Condition - (PREDICTED) Goal - (GOAL) Actual - (CURRENT)

Monthly Prod/Amount Countermeasures, Actions & Activities (100% Complete)

Put the letter of the Countermeasure that is completed in the correct quarter Notes / Comments

2016

JUL AUG SEP OCT NOV DEC JAN FEB MAR APR MAY JUN

78 25 50 75 25 53 25 50 75 25 50 75

Highlight % Completed Improvement measure the team is going to undertake

Person responsible for the work

Start Date Proj end date

When complete

Spread status

25

% IMPACT Responsible Start Date Due Date Complete Yokaten

50 75

Your Organization Here _____'Measure'________ Gate Chart

Department / Service Line Name Target (Step Goal)

Who dev?

Metric you are trying to impact Actual at time of dev.

Date at time of report

0.0% 20.0% 40.0% 60.0% 80.0% 100.0% 120.0% JUL AUG SEP OCT NOV DEC JAN FEB MAR APR MAY JUN Target Condition - (PREDICTED) Goal - (GOAL) Actual - (CURRENT)

slide-3
SLIDE 3

 Shift (how many?)  1  2*  3* Measure 1 2 3 4 5 6 7 8 9 10 11 12 13 14 15 16 17 18 19 20 21 22 23 24 25 26 27 28 29 30 31 Frequency (check one):

Day of Month

Plot points on horizontal grid lines. Connect points each day

Chart title: Month and Year: Contact Person: Department / Area:

slide-4
SLIDE 4

Pareto Chart

Month: 40

Directions: Place an X for each occurrence that corresponds to the appropriate issue. If issue is not listed, add issue below.

30 20 10 Root Cause of Issue

slide-5
SLIDE 5

Date Issue Corrective Action Status Action By: Target Date

Kaizen Newspaper

Area: