
SLIDE 1
9/19/2013 1
- Darin Nelson Senior Vice President
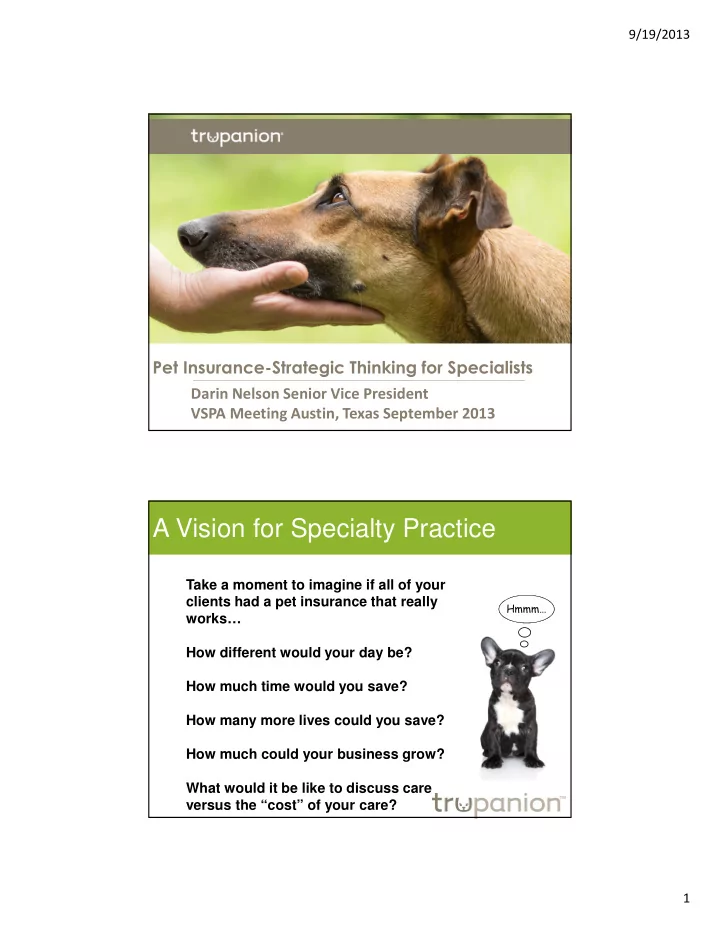
A Vision for Specialty Practice Take a moment to imagine if all of - - PDF document
9/19/2013 Darin Nelson Senior Vice President VSPA Meeting Austin, Texas September 2013 A Vision for
With pet insurance
Without pet insurance
1 Source: Survey: “Trupanion’s Use of Addressable Minds,”
April 2010, conducted for Trupanion pet insurance company by Onufrey Group LLC
2 Source: Morris Animal Foundation
1 Source: National Commission on Veterinary Economic Issues (NCVEI)
"#$$ %&'()*+ *,((*,)*,-
(*!)./*
!),0%,1'0*$
2,100,000 6,900,000 88,900,000 50,000,000 100,000,000 Searches for Pet Insurance Point of Sale vet visits
My name is Marvin. I am an Insurance guy!
Good Pet Insurance
Broker Profit
Underwriter Profit Direct Marketing Partner Marketing
Customer Experience
Fees & Taxes Profit Direct Marketing Customer Experience
Fees & Taxes
Traditional
Unlucky Pet Lucky Pet 50% 70% 100%
Unlucky pets receive far more money back then they will ever pay in. The very lucky pets subsidize the unlucky pets.
Average Pet Most pets fall into this middle section – which means they will receive 50% to 100% of their premiums back in the way of claims over their pet’s life.
*DVM Magazine, State of the Profession Survey 2012 – Median ATC=$130, 75th Percentile ATC =$173 $315 $692
$400 $600 $800
Average Revenue Per Pet
1.92 4.22 1 2 3 4 5
Increased Visits Per Year
*23*(977 *!
160K 346K 315K 692K 788K 1.73M 1.58M 3.46M $0.0M $0.5M $1.0M $1.5M $2.0M $2.5M $3.0M $3.5M $4.0M
$2.0M $2.2M $2.5M $2.9M $3.8M
$1.0M $1.5M $2.0M $2.5M $3.0M $3.5M $4.0M $4.5M
0% 5% 10% 20% 40%
Penetration Insured Pets
Sales Impact
Data pulled by Trupanion from a No Cal practice database, from 1/2012- 8/2013.
Emergency Ref 12 Month Total: $87,543 General Practice Clients 12 Month Total: $232,148
$10,000 $15,000 $20,000 $25,000 $30,000 $35,000 $40,000 $45,000 Jan-12 Feb-12 Mar-12 Apr-12 May-12 Jun-12 Jul-12 Aug-12 Sep-12 Oct-12 Nov-12 Dec-12 Jan-13 Feb-13 Mar-13
150%Patient Visits
Average Patient 2.2 Trupanion Patient 5.5
10% Invoice Total
Average Patient $238 Trupanion Patient $261
176% Annual Revenue Per Client
Average Client $524 Trupanion Client
171% Patient Visits
Average Patient 2.1 Trupanion Patient 5.7
12% Invoice Total
Average Patient $111 Trupanion Patient $98
139% Annual Revenue Per Client
Average Client $233 Trupanion Client $558
74% Patient Visits
Average Patient 1.9 Trupanion Patient 3.3
7% Invoice Total
Average Patient $266 Trupanion Patient $247
61% Annual Revenue Per Client
Average Client $505 Trupanion Client $815
Beta Hospital A Beta Hospital B Beta Hospital C
$*4*:$*2;
* Data based on 2013 Trupanion Express Practice Value Study
$2,000,000 $2,120,000
$1,900,000 $1,950,000 $2,000,000 $2,050,000 $2,100,000 $2,150,000 $2,200,000 Annual Revenues 12,195 12,935 11,000 11,200 11,400 11,600 11,800 12,000 12,200 12,400 12,600 12,800 13,000 Annual Visits 62 More Visits Per Month
$8*<+!)**.((
$2,676,450
$1,000,000 $1,500,000 $2,000,000 $2,500,000 $3,000,000 Year 1 Year 5
Compounded Revenue
$300,000 $468,375
$200,000 $300,000 $400,000 $500,000 Year 1 Year 5
EBITDA X6
$1,800,000 $2,810,250
$1,000,000 $1,500,000 $2,000,000 $2,500,000 $3,000,000 Year 1 Year 5
Practice Value
67=>'),*' ?369+
10,000,000 20,000,000 30,000,000 40,000,000 50,000,000 60,000,000 70,000,000 80,000,000 90,000,000 2012-TRU 2013-TRU EST 2014-IND EST
Claims
Claims