
SLIDE 1
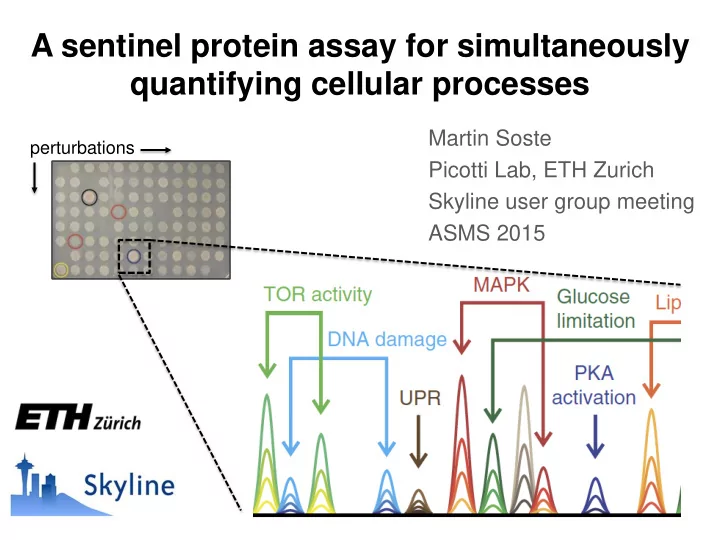
Martin Soste Picotti Lab, ETH Zurich Skyline user group meeting ASMS 2015
A sentinel protein assay for simultaneously quantifying cellular processes
perturbations
A sentinel protein assay for simultaneously quantifying cellular - - PowerPoint PPT Presentation
A sentinel protein assay for simultaneously quantifying cellular processes Martin Soste perturbations Picotti Lab, ETH Zurich Skyline user group meeting ASMS 2015 -Synuclein induced cytotoxicity 1 copy -Syn 2 copies -Syn Established
perturbations
collaboration with Lindquist lab
Cooper et al. Science. 2006 Gitler et al. Nat Genet. 2009 Willingham et al. Science. 2003 Yeger-Lotem et al. Nat Genet. 2009
α-Syn + gene n
gene n
unbiased Omics x not necessarily activity quantitative Targeted proteomics x biased x not necessarily activity
RT Intensity
RT Intensity
functional activity Cell biology & biochemistry x time and labour
Retention time
Intensity
gene n
α-Syn
(…..) (…..) (…..)
SENTINEL TYPE MODULE / PATHWA WAY DETAILS
ATG1
P-site AUTOPHAGY ACTIVATION Phosphorylated/dephosphorylated upon autophagy activation/deactivation
ATG13
P-site AUTOPHAGY ACTIVATION Phosphorylated/dephosphorylated upon autophagy activation/deactivation
IRE1
P-site UNFOLDED PROTEIN RESPONSE Autophosphorylated in UPR
HOG1
P-site MAPK SIGNALING Phosphorylation activates signaling
FUS3
P-site MAPK SIGNALING Phosphorylation activates signaling
SLT2
P-site MAPK SIGNALING Phosphorylation activates signaling
CKI1
P-site LIPID SYNTHESIS Phosphorylation by PKA regulates phosphatidylcholine synthesis
MAF1
P-site TOR SIGNALING Phosphorylated by PKA in a TORC1-dependent manner
SCH9
P-site TOR SIGNALING Phosphorylated by TORC1-complex
YPK1
P-site TOR SIGNALING Phosphorylated by TORC2-complex
IGO1
P-site RIM15 - KINASE ACTIVITY Phosphorylated by RIM15
MIG1
P-site GLUCOSE REPRESSION Phosphorylated by Hxk2 (glucose repression/deprepression)
SUI2
P-site TRANSLATION Phosphorylated when inhibition of translation initiation is required
DUN1
P-site DNA DAMAGE Phosphorylated in response to DNA damage.
SLX4
P-site DNA DAMAGE Phosphorylated by ATR and ATM upon DNA damage
TLG1
P-site TPK1 - KINASE ACTIVITY Phosphorylated TPK1 and dephosphorylated by SIT4
TLG1
P-site SIT4 - PHOSPHATASE ACTIVITY Phosphorylated TPK1 and dephosphorylated by SIT5
SIP1
P-site SNF1 - KINASE ACTIVITY Phosphorylated by SNF1.
CTK1
P-site CAK1 - KINASE ACTIVITY Phosphorylated by CAK1
ADR1
P-site PKA - KINASE ACTIVITY Phosphorylation by PKA
SEC63
P-site CK2 - KINASE ACTIVITY Phosphorylated by casein kinase II
CDC23
P-site CELL CYCLE Phosphorylated by CDC28 --> early mitotic activity
CDC24
P-site CDC28 - KINASE ACTIVITY Phosphorylation by CDC28 activates early mitotic activity
CDH1
P-site CELL CYCLE Phosphorylated by CDC28, in S, G2 and M phase
CDH1
P-site CDC28 - KINASE ACTIVITY Phosphorylated by CDC28, in S, G2 and M phase
Bcy1
P-site YAK1 - KINASE ACTIVITY Phosphorylated by YAK1 in response to glucose starvation.
YPK1
P-site PKH1 - KINASE ACTIVITY Phosphorylated by Pkh1
NPR1
P-site NITROGEN METABOLISM Dephosphorylated upon nitrogen limitation
RCK2
P-site HOG1 - KINASE ACTIVITY Phosphorylated by HOG1 after osmotic stress.
PROT – 300, PHOS – 152
Control
Multi-peptide chromatograms
Osmo-stress Osmo-stress adapted Rapamycin AA/N starvation Stationary phase Heat shock 30 min Heat shock 60 min Heat shock recovery
Heat shock Heat-shock recov. Osmo-stress Quiescence Rapamycin Osmo-stress adapt. AA/N starvation
= detected, not regulated = not detected Soste et al. Nat Methods. 2014
20 40 60 80 100 120 10 20 30
Biomass (scattered light) Time (hr.)
Vector aSyn aSyn+UBP7 aSyn+PPZ2 aSyn+YPT1 aSyn+YKT6 aSyn+YPK9 aSyn+NTH1 aSyn+IME2 aSyn+NVJ1
Protective genes (~100) Sentinels Multivariate regression
gene n
α-Syn
Data analysis Andreas Beyer, Sybacol α-Syn model Susan Lindquist, WIBR Gabriela Caraveo, WIBR Sentinel Prediction Stefanie Wanka, UZH Christian Von Mering, UZH
Supervisor Paola Picotti Picotti Lab Andre Melnik Yuehan Feng Juan Gerez Rita Hrabakova Paul Boersema Pascal Leuenberger Ilaria Piazza Simone Schopper Natalia Prymaczok Marco Tognetti
Thank you to Brendan, the development team and the user community! martin.soste@bc.biol.ethz.ch
Picture on title slide from Cooper et al. 2006