
SLIDE 1
1 Ipsos MORI
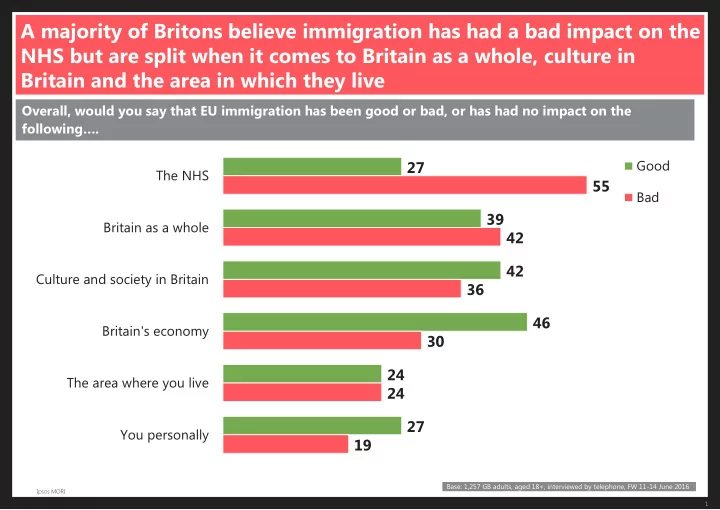
A majority of Britons believe immigration has had a bad impact on the NHS but are split when it comes to Britain as a whole, culture in Britain and the area in which they live
27 39 42 46 24 27 55 42 36 30 24 19
The NHS Britain as a whole Culture and society in Britain Britain's economy The area where you live You personally Good Bad Overall, would you say that EU immigration has been good or bad, or has had no impact on the following….
Base: 1,257 GB adults, aged 18+, interviewed by telephone, FW 11-14 June 2016