
A controlled trial to allow motorcycles on bus lanes in Tel-Aviv: an assessment of mobility and safety impacts
Victoria Gitelman Roby Carmel Anna Korchatov
Transportation Research Institute Technion – Israel Institute of Technology
31st ICTCT Conference in Porto, Portugal October 25 & 26, 2018
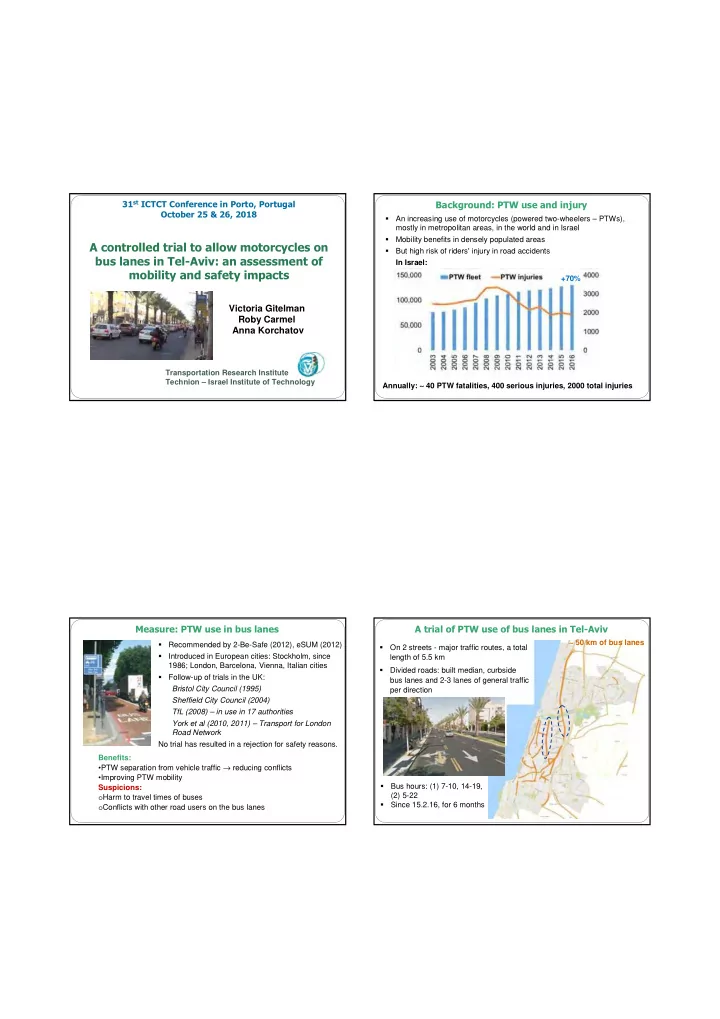
Background: PTW use and injury
- An increasing use of motorcycles (powered two-wheelers – PTWs),
mostly in metropolitan areas, in the world and in Israel
- Mobility benefits in densely populated areas
- But high risk of riders' injury in road accidents
In Israel: Annually: ∼ 40 PTW fatalities, 400 serious injuries, 2000 total injuries +70%
Measure: PTW use in bus lanes
- Recommended by 2-Be-Safe (2012), eSUM (2012)
- Introduced in European cities: Stockholm, since
1986; London, Barcelona, Vienna, Italian cities
- Follow-up of trials in the UK:
Bristol City Council (1995) Sheffield City Council (2004) TfL (2008) – in use in 17 authorities York et al (2010, 2011) – Transport for London Road Network No trial has resulted in a rejection for safety reasons. Benefits:
- PTW separation from vehicle traffic → reducing conflicts
- Improving PTW mobility
Suspicions:
- Harm to travel times of buses
- Conflicts with other road users on the bus lanes
A trial of PTW use of bus lanes in Tel-Aviv
∼ 50 km of bus lanes
- On 2 streets - major traffic routes, a total
length of 5.5 km
- Divided roads: built median, curbside
bus lanes and 2-3 lanes of general traffic per direction
- Bus hours: (1) 7-10, 14-19,
(2) 5-22
- Since 15.2.16, for 6 months