A Case Study -- Chu et al. The Transcriptional Program of An - - PowerPoint PPT Presentation

a case study chu et al the transcriptional program of
SMART_READER_LITE
LIVE PREVIEW

A Case Study -- Chu et al. The Transcriptional Program of An - - PowerPoint PPT Presentation

A Case Study -- Chu et al. The Transcriptional Program of An interesting early microarray paper Sporulation in Budding Yeast My goals Show arrays used in a real experiment Show where computation is important S. Chu, * J.


slide-1
SLIDE 1

CSE 527, W.L. Ruzzo 1

1

A Case Study -- Chu et al.

 An interesting early microarray paper  My goals

 Show arrays used in a “real” experiment  Show where computation is important  Start looking at analysis techniques

The Transcriptional Program of Sporulation in Budding Yeast

  • S. Chu, * J. DeRisi, * M. Eisen, J.

Mulholland, D. Botstein, P. O. Brown,

  • I. Herskowitz

Science, 282 (Oct 1998) 699-705

3

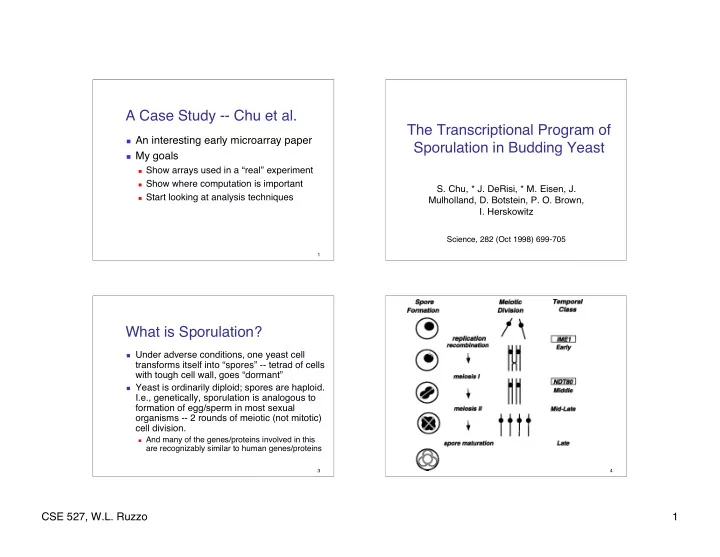
What is Sporulation?

 Under adverse conditions, one yeast cell

transforms itself into “spores” -- tetrad of cells with tough cell wall, goes “dormant”

 Yeast is ordinarily diploid; spores are haploid.

I.e., genetically, sporulation is analogous to formation of egg/sperm in most sexual

  • rganisms -- 2 rounds of meiotic (not mitotic)

cell division.

 And many of the genes/proteins involved in this

are recognizably similar to human genes/proteins

4

slide-2
SLIDE 2

CSE 527, W.L. Ruzzo 2

5

The Chu et al. Experiment

 Measure mRNA expression levels of all

6200 yeast genes in 7 time points (0-11 hours) in a (loosely synchronized) sporulating yeast culture

 Compare level at time t to level at

time 0 on 2-color cDNA array

 Plus some more standard tests as

controls

6

Measures of Sporulation

NB: < 20% spores, so data are mixtures of cell stages

7

Standard Test (Northern) vs Array

8

Prototype Expression Profiles

slide-3
SLIDE 3

CSE 527, W.L. Ruzzo 3

9 10

"Sporulation" Summary, I

 What they did:

 measured mRNA expression levels of all 6200 yeast genes

in 7 time points in a (loosely synchronized) sporulating yeast culture

 plus some more standard tests as controls

 What they learned:

 3-10x increase in number of genes implicated in various

subprocesses

 several subsequently verified by direct knockouts  further evidence for significance of some known transcription

factors and/or binding motifs

 several potential new ones  evidence for existence of others

11

"Sporulation" Summary, II

 Where computation fits in

 automated sample handling  image analysis  data storage, retrieval, integration  visualization  clustering  sequence analysis

 similarity search  motif discovery

 structure prediction

More on these topics later in the course

12

More on Computation

 Similarity Search -- given a loosely defined

sequence “motif”, e.g. a transcription factor binding site, scan genome for “matches”

 “Which genes have an MSE element?”  E.g., weight matrix models, Markov models

 Motif discovery -- given a collection of

sequences presumed to contain a common pattern, e.g. a transcription factor binding site, find it & characterize it

 “What motifs are common to Early Middle genes?”  E.g., MEME, Gibbs Sampler, Footprinter, …

slide-4
SLIDE 4

CSE 527, W.L. Ruzzo 4

13

More on Computation

 Finding groups of sequences that

plausibly contain common sequence motifs

 E.g., clustering (co-varying because co-

regulated?)

14

Chu’s “Supervised” Clustering

 Hand picked ~ 40 prototype genes

 With significant variation in data set  With known function

 Hand-segregated into 7 groups (“Early”, …)  Assign all others to “nearest” group

 Based on Pearson correlation to per-group

averages of prototypes

 For visualization, order within groups by

correlation to neighboring groups

15

Critique

+

  • 16

2 warnings about arrays & clusters

 Warning 1:

expression data often do not separate into nice, compact, well-separated clusters

 Cf Raychaudhuri et al. (next 2 slides)

slide-5
SLIDE 5

CSE 527, W.L. Ruzzo 5

17 18 19

2 warnings about arrays & clusters

 Warning 2:

it’s hard to visualize high-dimensional data & inadequate visualization may

  • bscure as well as enlighten

 Cf Next 2 slides. 20

slide-6
SLIDE 6

CSE 527, W.L. Ruzzo 6

21