
SLIDE 1
1
LIFESTYLE COMMUNITIES LIMITED A BUSINESS FOR PURPOSE
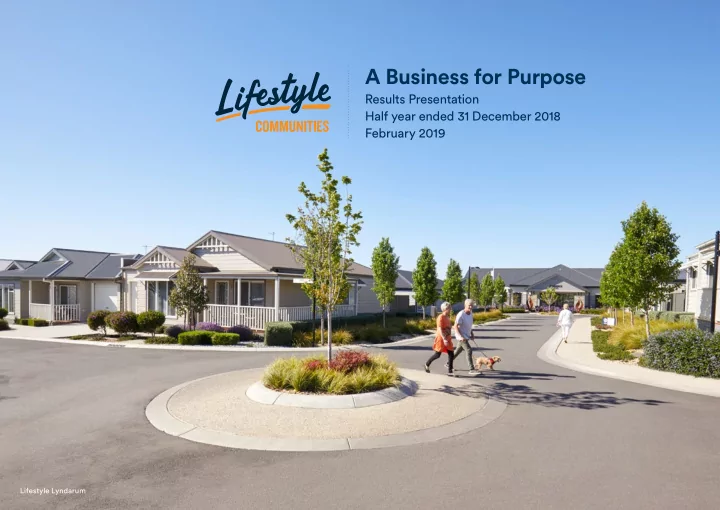
A Business for Purpose
Results Presentation Half year ended 31 December 2018 February 2019
Lifestyle Lyndarum
A Business for Purpose Results Presentation Half year ended 31 - - PowerPoint PPT Presentation
A Business for Purpose Results Presentation Half year ended 31 December 2018 February 2019 LIFESTYLE COMMUNITIES LIMITED A BUSINESS FOR PURPOSE 1 Lifestyle Lyndarum Contents Appendix 1. Overview 3 A.1 Model of Living 26 2. Financial
1
LIFESTYLE COMMUNITIES LIMITED A BUSINESS FOR PURPOSE
Results Presentation Half year ended 31 December 2018 February 2019
Lifestyle Lyndarum
2
LIFESTYLE COMMUNITIES LIMITED A BUSINESS FOR PURPOSE
3
10
20
24
A.1 Model of Living 26 A.2 Growing Recurring Revenue 27 A.3 Industry Dynamics 28 A.4 Land Acquisition Strategy 29 A.5 Sales and Settlements 30 A.6 Deferred Management Fees 31 A.7 Cash Flow Analysis (1HFY19) 32 A.8 Cash Flow Analysis (1HFY18) 33 Lifestyle Offjcer
3
LIFESTYLE COMMUNITIES LIMITED A BUSINESS FOR PURPOSE
2003 James Kelly, Dael Perlov and Bruce Carter develop business plan 2004 Development of fjrst community at Brookfjeld - Opened in June 2005 2007 Listed on the Australian Stock Exchange 2012 Major capital raising
2014 1,000th homeowner moves in 2016 2,000th homeowner moves in/ 10th Community Clubhouse opens 2018 Acquired 17th community site/ 3,000th homeowner moves in
4
LIFESTYLE COMMUNITIES LIMITED A BUSINESS FOR PURPOSE
An afgordable and sustainable fjnancial model where homeowners can prosper An empowering and engaging customer service strategy that reimagines traditional retirement High quality resort style facilities that exceed expectation and are actively maintained and refurbished. An afgordable housing option - 50% of Australians aged over 50 who have less than $620,000 in total equity Yvonne and Tony Scott, Homeowners at Lifestyle Offjcer
5
LIFESTYLE COMMUNITIES LIMITED A BUSINESS FOR PURPOSE
Financial Summary
1HFY19 ($ Million) 1HFY18 ($ Million)
Net profjt after tax attributable to shareholders $21.9 million $15.8 million Total assets $426.9 million $275.8 million Equity $223.4 million $169.5 million Dividend (interim) 2.5 cents per share 2.0 cents per share Net debt $62.3 million $39.4 million Net debt to net debt plus equity 21.8% 18.9%
1HFY19 results snapshot
Growing annuity income streams
Total number of homes settled (Cumulative) Number of resales attracting a DMF
1HFY13 614 4 2HFY13 695 6 1HFY14 804 10 2HFY14 906 13 1HFY15 1,004 17 2HFY15 1,146 17 1HFY16 1,256 26 $12,000,000 $10,000,000 $8,000,000 $6,000,000 $4,000,000 $2,000,000 2HFY16 1,348 26 1HFY17 1,476 34 2HFY17 1,626 39 1HFY18 1,776 26 2HFY18 1,947 33
Site Rental Fees (gross) Deferred Management Fee (cash)
1HFY19 2,133 30
(1) (2) Notes: (1) Represents gross numbers not adjusted for joint venture interests (2) Total resale settlements were 41, of which 30 attracted a DMF
6
LIFESTYLE COMMUNITIES LIMITED A BUSINESS FOR PURPOSE
$21.9m from $15.8m in 1HFY2018
Notes: (1) Represents gross numbers not adjusted for joint venture interests (2) Settled, under development or subject to planning
1HFY19 Highlights
A repeatable business model structured for sustainable growth
Home sites (annuities) under management(1)
2200 2000 1800 1600 1400 1200 1000 800 600 400 200 2008 2009 2010 2011 2012 2013 2014 2015 2016 2017 2018 1H2019 2,133(1) Financial year
7
LIFESTYLE COMMUNITIES LIMITED A BUSINESS FOR PURPOSE
Shepparton Lyndarum Officer Hastings Chelsea Heights Brookfield Berwick Waters Seasons Geelong Casey Fields Warragul Bittern Ocean Grove
Community Homes Settled
Brookfjeld at Melton 228 100% Seasons at Tarneit 136 100% Warragul 182 100% Casey Fields at Cranbourne 217 100% Chelsea Heights 186 100% Hastings 141 100% Offjcer 151 100% Lyndarum at Wollert 154 100% Shepparton 301 87% Geelong 164 97% Berwick Waters 216 89% Bittern 209 46% Ocean Grove 220 12% Mount Duneed 191
165
243
260
Notes: (1) Commencement of construction subject to planning approval.
(2) Represents gross numbers not adjusted for joint venture interests at Cranbourne and Chelsea Heights.
Focus remains in Victoria
management of communities
Mount Duneed
17 communities in planning, development or under management
Kaduna Park
Wollert North Plumpton
8
LIFESTYLE COMMUNITIES LIMITED A BUSINESS FOR PURPOSE
Communities Total homes in communities Homes sold &
Homes sold & awaiting settlement Homes occupied or sold and awaiting settlement No. %
Existing Communities – Sold out Brookfjeld at Melton 228 228
100% Seasons at Tarneit 136 136
100% Warragul 182 182
100% Casey Fields at Cranbourne(1) 217 217
100% Chelsea Heights(1) 186 186
100% Hastings 141 141
100% Lyndarum at Wollert 154 154
100% Offjcer 151 151
100% Existing Communities – Under construction/Settling out Shepparton 301 263 10 273 91% Geelong 164 159 4 163 99% Berwick Waters 216 192 19 211 98% Bittern 209 97 96 193 92% Ocean Grove 220 27 85 112 51% Mount Duneed 191
22 10% New Communities – Awaiting commencement Kaduna Park at Offjcer South(2) 165
36 20% Wollert North(2) 243
260
3,364 2,133 272 2,405 71%
Lifestyle Communities’ portfolio continues to grow organically
Portfolio snapshot 1HFY19
Notes: (1) Represents 100% of the development of which Lifestyle Communities shares 50% (2) Commencement of construction subject to planning approval (3) Lifestyle Communities will have an economic interest in 3,163 home sites
9
Financial & operational results
Lifestyle Shepparton
10
Median House Prices for Lifestyle's Sales Catchments ($'000)
Median house prices in the catchments where Lifestyle Communities is selling increased in 2018
10
LIFESTYLE COMMUNITIES LIMITED A BUSINESS FOR PURPOSE
Shepparton - 85.4%
$700 $600 $500 $400 $300 $200 $100 2016 2017 2018
LIC AVE
Bittern - 61.7%
$700 $600 $500 $400 $300 $200 $100 2016 2017 2018
LIC AVE
549 648 682 421
Berwick Waters - 76.4%
$700 $600 $500 $400 $300 $200 $100 2016 2017 2018
LIC AVE
463 554 567 433 287 286 295 252
Ocean Grove - 64.7%
$700 $600 $500 $400 $300 $200 $100 2016 2017 2018
LIC AVE
Mount Duneed - 74.7%
$700 $600 $500 $400 $300 $200 $100 2016 2017 2018
LIC AVE
511 570 605 452
Kaduna Park - 76.4%
$700 $600 $500 $400 $300 $200 $100 2016 2017 2018
LIC AVE
483 566 597 456 546 598 646 418
Notes: - Median house prices shown above represent the weighted average median house price for the relevant catchment
Melbourne have decreased, median house prices in the outer suburbs and urban fringe catchments where Lifestyle
allow for substantial equity release
released $212k equity when they sold (which suggests we are attracting customers from above the median)
resales increased to $393k compared to $366k in the prior half year, an increase
11
11
LIFESTYLE COMMUNITIES LIMITED A BUSINESS FOR PURPOSE
Putting the extra in the ordinary
Lifestyle's Wellness programme continues to gain momentum and participation, particularly with the emerging baby boomer, through:
before they move in, creating a personalised and less confronting induction into their new community
related topics
experiences our communities provide
such as Autumn and Spring carnivals
Zumba, Aqua Aerobics and Pickleball to name a few
This year we ran the inaugural Lifestyle has Talent for homeowners with 29 acts and an audience of over 1,000 homeowners.
Driving homeowner engagement and ultimately referral
Visit bit.ly/LHT2018 to watch Lifestyle has Talent on YouTube
12
LIFESTYLE COMMUNITIES LIMITED A BUSINESS FOR PURPOSE
will change as the Company commences actively selling new communities at Kaduna Park, Wollert North and Plumpton during the next six months
suite was opened in December
1HFY13 2HFY13 1HFY14 2HFY14 1HFY15 2HFY15 1HFY16 150 100 50 200 300 250 2HFY16 1HFY17
Sales (net) Settlements
Homes
2HFY17 1HFY18 2HFY18 1HFY19
Community
No.of Homes Sold % Sold
Shepparton 301 273 91% Geelong 164 163 99% Berwick Waters 216 211 98% Bittern 209 193 92% Ocean Grove 220 112 51% Mount Duneed 191 22 10% Kaduna Park 165 36 20%
13
LIFESTYLE COMMUNITIES LIMITED A BUSINESS FOR PURPOSE
additional sales support resources to optimise the customer experience
to changing market conditions
reduces risk by supporting a more aggressive construction program to enable faster capital recycling
The higher the sales rate, the faster capital can be recycled to undertake more communities
Month
50 100 150 200 1 2 3 4 5 6 7 8 9 10 11 12 13 14 15 16 17 18 19 20 21 22 23 24 25 26 27 28 29 30 31 32 33 34 35 36
Casey Fields Hastings Lyndarum Bittern Berwick Waters Ocean Grove Chelsea Heights Officer Brookfield Geelong Seasons Warragul Shepparton
Sales
Sales profjle from date of fjrst sale
Kaduna Park Mount Duneed
14
LIFESTYLE COMMUNITIES LIMITED A BUSINESS FOR PURPOSE
subject to planning approvals
increases the number of planned homes from 135 to 243
planning approvals
15
LIFESTYLE COMMUNITIES LIMITED A BUSINESS FOR PURPOSE
Annuity income will continue to increase through new home settlements, rental increases and resales of existing homes
There are two components to the annuity stream:
week per home
1HFY19(1) (total of 41). Average tenure was 5.4 years and capital growth of 9.4% per annum
Notes: (1) Inclusive of selling and administration fees (2) Represents gross numbers not adjusted for joint venture interests
Home sites (annuities) under management(1)
2200 2000 1800 1600 1400 1200 1000 800 600 400 200 2008 2009 2010 2011 2012 2013 2014 2015 2016 2017 2018 Financial year 1H2019 2,133(2)
16
LIFESTYLE COMMUNITIES LIMITED A BUSINESS FOR PURPOSE
increase in settlements revenue (186 settlements in FY19 compared to 150 in FY18)
with each home (1HFY18 $11.8m)
number of homes under management and a rental increase of 3.5%
in 1HFY19 compared to 26 in 1HFY18. The average deferred management fee (pre joint venture share and excluding selling and administration fees) increased to $66k per sale compared to $61k per sale in the prior half year
$0.9m in 1HFY18. This is due to a higher proportion of sales at joint venture communities, increased sales and marketing activities, and the cost of additional resourcing to support future scalability
Income statement 1HFY19 ($’000) 1HFY18 ($’000) % Movement
Home settlement revenue 62,962 46,637 35.0% Cost of sales (48,324) (35,762) 35.1% Gross profjt 14,637 10,875 34.6% Home settlement margin 23.2% 23.3% <0.1% Management and other revenue Site rental 9,774 8,124 20.3% Deferred management fees 2,422 1,943 24.7% Other revenue 1,634 1,115 46.5% Total management and other revenue 13,830 11,183 23.7% Fair value adjustments 19,608 14,290 37.2% Development expenses (3,160) (3,064) 3.1% Management rental expenses (4,292) (3,664) 17.1% DMF expenses (1,332) (849) 56.9% Corporate overheads (4,957) (3,613) 37.2% Finance costs (622) (532) 16.9% Other expenses (1,594) (1,127) 41.4% Net profjt before tax 32,119 23,497 36.6% Net profjt after tax 21,940 16,069 36.0% Profjt is attributable to: Non-controlling interests 221 Members of the parent 21,940 15,847 38.6%
17
LIFESTYLE COMMUNITIES LIMITED A BUSINESS FOR PURPOSE
which were delayed in settlement due to delays with the public access road. The community opened in late December and the inventory will reduce in the second half
deposits for land at Wollert North and Plumpton, and signifjcant development activity at Bittern and Ocean Grove
December 2018. The increased utilisation was used to fund land settlements at Bittern and Mount Duneed, deposits for Wollert and Plumpton, and the development phase for Bittern and Ocean Grove
for contracts entered into prior to 31 December 2018 which are expected to settle during 2019
This tax liability would only be realised if a community was sold, which is highly unlikely
Balance sheet highlights 1HFY19 ($’000) 2HFY18 ($’000) % Movement
Cash and cash on deposit 7,671 8,585 10.6% Inventories 51,367 39,439 30.2% Investment properties 360,033 303,573 18.6% Other assets 7,883 6,619 19.1% Total assets 426,954 358,216 19.2% Bank overdraft
73,282 59,808 22.5% Current tax payable 703 1,132 37.9% Interest-bearing loans and borrowings 70,000 40,000 75.0% Deferred tax liabilities 58,647 51,889 13% Other liabilities 894 833 7.3% Total liabilities 203,526 153,662 32.5% Net assets 223,427 204,554 9.2% Gearing(1) 21.8% 13.3%
Notes: (1) Calculated as a ratio of net debt to net debt plus equity (net debt includes cash, cash on deposit and bank overdraft)
18
LIFESTYLE COMMUNITIES LIMITED A BUSINESS FOR PURPOSE
Bittern and Ocean Grove of $17.8 million as the projects were in their development phase
Bittern and Mount Duneed and deposits for Plumpton and the additional site at Wollert
Ocean Grove in the fjnal week before Christmas. The funds will be used to settle the land at Ocean Grove early in 2019
completed homes at Ocean Grove
Cash Flow highlights 1HFY19 ($’000) 1HFY18 ($’000)
Receipts from customers 76,481 63,683 Payments to suppliers and employees(1) (77,017) (51,838) Income taxes paid (3,614) (2,752) Net interest payments (1,328) (919) Cash fmows from operations (5,478) 8,174 Purchase of PP&E (1,186) (324) Purchase of investment properties (20,837) (1,930) Cash fmows from investing activities (22,023) (2,254) Net movement in borrowings 30,000 (7,000) Proceeds from exercise of options 175 Purchase of Treasury shares (800) Dividends paid (2,614) (2,091) Cash fmows from fjnancing activities 26,586 (8,916) Net cash fmows (915) (2,996) Cash at the beginning of the year 8,585 3,641 Cash at the end of the year 7,671 645
Notes: (1) Due to Lifestyle Communities’ accounting policies and legal structure, payments to suppliers and employees includes all gross costs of infrastructure construction (i.e. civil works, clubhouse and other facilities). Under some other structures these costs may be classifjed as investing cash fmows. Therefore cash fmows from operations will be negatively impacted when Lifestyle Communities is in the cash intensive development phase of a community. To assist with further understanding of cash fmows, please refer to Appendix 7 and 8 for a detailed break-down of development and management cash fmows per community for FY19 and FY18.
19
Outlook
20
LIFESTYLE COMMUNITIES LIMITED A BUSINESS FOR PURPOSE
Settlements of 630-695 expected to be delivered in FY19 and FY20
FY18 settlements (Actual) FY19 settlements (Actual) FY19 settlement range FY20 settlement range TOTAL 321 186 310-350 300-345
Shepparton 48 16 20-30 20-25 Lyndarum 40
57 16 20
26
125 55 65-70 5-10 Bittern 25 72 140-150 20-30 Ocean Grove
65-80 110-115 Mount Duneed
Kaduna Park(1)
Wollert North(1)
Notes: (1) Settlement goals dependent on construction commencement date and planning approvals
settlements
projection for FY20 which is indicative only. They are dependent
sites not yet settled at Wollert North and Kaduna Park and market conditions
New sales
21
LIFESTYLE COMMUNITIES LIMITED A BUSINESS FOR PURPOSE
Community FY19 FY20 FY21
Q1 Q2 Q3 Q4 Q1 Q2 Q3 Q4 Q1 Q2 Q3 Q4
Shepparton Geelong Berwick Waters Bittern Ocean Grove Mount Duneed Kaduna Park(1) Wollert North(1) Plumpton(1)
Notes: (1) Subject to planning approval
Represents tail of development which is
Pipeline continues to fill in Melbourne and Geelong's key growth corridors
22
LIFESTYLE COMMUNITIES LIMITED A BUSINESS FOR PURPOSE
The growing level of free cash flow from the annuities provides the basis for increasing dividends over time
As a general principle, the Board of Lifestyle Communities intends to pay dividends out of post tax, operating cashfmow generated from community management including:
rental and DMF)
the communities (currently 50%)
Dividend
declared in respect of 1HFY19 (the dividend has a record date of 8 March 2019 and a payment date of 5 April 2019)
Surplus franking credits
(after allowing for the interim dividend and tax payable for 1HFY19)
New aqua club at Lifestyle Ocean Grove
23
Summary
Lifestyle Berwick Waters
24
LIFESTYLE COMMUNITIES LIMITED A BUSINESS FOR PURPOSE
extension of the Wollert North site have increased the total portfolio to 3,364 homes(1)
for the half year as a result of having 2,133 settled homes
$21.9m
2.0 cents per share in FY18)
every 12 months subject to identifjcation of appropriate sites
A proven business that is structured for long term sustainable growth
Notes: (1) Settled, under development or subject to planning
Barry and Lois McLarty, Homeowners at Lifestyle Berwick Waters
25
Lifestyle Berwick Waters
26
How does the Lifestyle Communities model of living work?
A 90 year lease provides security of tenure. Homeowners at Lifestyle Communities are protected by the Residential Tenancies Act. Homes typically priced at 75-80%
house price. The weekly site fee is approx. 20% of the Age Pension after receipt of the Commonwealth Rental Assistance. Homeowners at Lifestyle Communities own their
homes are located, via a weekly site fee.
AFFORDABLE LIVING
On average, release of approximately $129,000 equity upon sale of old home. The weekly site fee is approximately 20 - 22% of the Age Pension after receipt of Commonwealth Rental Assistantance.
Release of an average of $212,000 equity upon sale of existing home. 26
LIFESTYLE COMMUNITIES LIMITED A BUSINESS FOR PURPOSE
27
The speed at which Lifestyle can create new communities is limited by the size of the capital pool and the speed at which it can recover its capital through new home settlements.
Recycling capital pool
Completed communities building a long term sustainable income and future dividends
Growing annuity income streams
$22,000,000 $20,000,000 $18,000,000 $16,000,000 $14,000,000 $12,000,000 $10,000,000 $8,000,000 $6,000,000 $4,000,000 $2,000,000
Total number of homes settled (Cumulative) Number of resales attracting a DMF Site Rental Fees (gross) Deferred Management Fee (cash)
2007 100
138
202 4 2010 305 11 2011 412 8 2012 546 11 2013 695 10 2014 906 23 2015 1,146 34 2016 1,348 52 Financial Year 2017 1,626 73 2018 1,947 59
Lifestyle's business has two core elements
A mix of equity and debt capital is used to develop greenfjeld sites to create new communities. Capital is recovered from one community and is recycled into the next project.
Completed communities generate recurring revenue streams which are growing as new communities are added to the portfolio.
27
LIFESTYLE COMMUNITIES LIMITED A BUSINESS FOR PURPOSE
Current speed of recycling allowing the development of one
28
LIFESTYLE COMMUNITIES LIMITED A BUSINESS FOR PURPOSE
Key themes
The industry fundamentals are driven by favourable medium term demographic trends Strong Growth In Demand Expected Housing Afgordability Baby Boomers Supply
to 11.4m by 2050
population as a whole over the same period
population currently live in Residential Land Lease
below the ~6% penetration rates achieved in more mature markets like the USA
prices over the last ten years with annualised growth rate experienced in Victoria of 5.7% pa
Communities ofger an
release a material amount
lower cost alternatives
their lives
for new land lease operators entering the market
deployed is on brownfjeld recycling not adding new homes to the overall supply
supply in the medium term
29
LIFESTYLE COMMUNITIES LIMITED A BUSINESS FOR PURPOSE
Plan to acquire one or two new sites every 12 months
Focused on Melbourne and Geelong’s growth corridors
complete
topography which increases site choice
growth corridor
serviced zoned land in each catchment
Communities starts the development as soon as possible after acquisition of the site
Wyndham Melton Hume Whittlesea Casey Cardinia Melbourne Mornington Peninsula Bellarine Peninsula
Lifestyle Communities undertakes a detailed vetting of each potential site, and prioritises acquisition of sites based on the following criteria
Our Victorian focus is driven by
30
LIFESTYLE COMMUNITIES LIMITED A BUSINESS FOR PURPOSE
New home settlements Net sales commitments Resale home settlements Resale homes net sales commitments Mature Communities 1HFY19 1HFY18 1HFY19 1HFY18 1HFY19 1HFY18 1HFY19 1HFY18 Brookfjeld at Melton
8 9 4 Seasons
4 2 3 Casey Fields at Cranbourne(1)
6 5 1 Chelsea Heights(1)
3 6 4 Hastings
4 2 3 Lyndarum at Wollert
3
1 Offjcer
2
Communities under development Shepparton 16 20 6 21 1 1 1 4 Geelong 16 22 3 21 2
55 51 3 53
72
46
27
31
186 150 94 181 30(2) 26 30 21
Notes: (1) Represents gross numbers not adjusted for joint venture interests (2) Total resales were 41, of which 30 attracted a DMF.
31
LIFESTYLE COMMUNITIES LIMITED A BUSINESS FOR PURPOSE
Brookfield Seasons Warragul Casey Fields Shepparton Chelsea Heights Hastings Lyndarum Officer Geelong Total
Historical resales(1) 119 26 55 41 12 30 25 4 5 2 319 Average tenure (years) 6.1 5.3 4.4 3.5 3.3 3.1 2.5 2.6 1.6 2.1 4.6 Average price growth p.a. 5.0% 3.6% 3.6% 5.9% 3.5% 18.9% 14.4% 12.4% 13.7% 9.4% 7.0% Average purchase price (move in) 192,299 231,385 241,420 293,951 219,501 321,760 286,493 335,331 320,653 321,060 242,212 Average sales price (move out) 242,744 275,673 277,145 356,927 242,417 502,366 384,540 438,750 389,200 382,500 307,180 Average DMF(2) 38,852 47,734 45,498 52,517 36,443 70,593 46,403 47,800 35,556 37,900 46,019 Average DMF rate 16.1% 17.3% 16.3% 14.4% 15.3% 13.6% 11.8% 11.0% 9.2% 10.0% 15.2% 1HFY19 resales(1) 6 2 3 6 1 5 1 3 1 2 30 Average tenure (years) 10.06 7.90 5.60 3.86 5.68 4.84 4.16 2.59 0.93 2.05 5.4 Average price growth p.a. 6.9% 5.8% 3.7% 6.4% 2.3% 18.2% 8.4% 13.2% 18.7% 9.4% 9.4% Average purchase price (move in) 186,205 225,950 256,133 313,735 185,715 325,877 343,082 322,858 242,690 321,060 274,384 Average sales price (move out) 310,500 330,000 306,667 390,000 210,000 604,000 462,500 430,000 285,000 382,500 393,850 Average DMF(2) 54,575 82,000 61,333 59,293 42,000 115,504 92,500 45,133 28,500 37,900 66,098 Average DMF rate 17.5% 25.0% 20.0% 15.3% 20.0% 19.2% 20% 10.7% 10.0% 10.0% 16.8% Total DMF received(2) 327,450 164,000 184,000 355,760 42,000 577,520 92,500 135,400 28,500 75,800 1,982,930 FY18 resales(1) 14 5 10 9 4 6 7 1 4
Average tenure (years) 8.7 5.4 6.4 4.6 4.1 3.7 3.0 2.5 1.7
Average price growth p.a. 6.1% 5.1% 4.1% 7.6% 2.7% 21.3% 15.8% 9.8% 12.5%
Average purchase price (move in) 196,348 264,867 256,745 301,611 235,535 310,798 286,534 372,750 340,144
Average sales price (move out) 293,464 351,500 322,400 402,167 260,500 548,667 420,357 465,000 415,250
Average DMF(2) 53,431 52,263 57,995 71,118 47,000 92,667 57,100 55,800 37,320
Average DMF rate 18.3% 14.8% 17.8% 17.8% 18% 16.7% 13.7% 12.0% 9.0%
Total DMF received(2) 748,030 209,050 579,950 640,060 188,000 556,000 399,700 55,800 149,280
Notes: (1) Includes resales that attracted a DMF only (2) Excludes selling and administration fees
32
LIFESTYLE COMMUNITIES LIMITED A BUSINESS FOR PURPOSE
Supplementary Cash Flow Analysis for 1HFY19 Brookfield Seasons Warragul Casey Fields Shepparton Chelsea Heights Hastings Lyndarum Geelong Officer Berwick Waters Bittern Ocean Grove Mount Duneed Kaduna Park Wollert North Plumpton Total Total Number of Homes 228 136 182 217 301 186 141 154 164 151 216 209 220 191 165 243 260 3,364 Settled 1HFY19
55 72 27
Remaining homes and lots available to settle
112 194 191 165 130 243 1,122 Capital Cash Flows ($million) Land
(2.27) (20.84) Development Expenditure (development and sales)
(0.54) (0.04) (1.12) (5.68) (7.90) (1.99) (0.25) (0.22)
Home Construction
(18.08) (13.15) (0.07)
Home Settlements
4.94
24.56 9.60
Net Development Cash Flows
3.51 (0.04) 11.36 (6.33) (11.46) (12.67) (0.25) (1.34) (2.27) (21.71) Annuity Cash Flows ($million) Site Rentals (incl. management fees) 1.04 0.66 0.92 1.09 1.29 0.92 0.72 0.77 0.78 0.76 0.84
DMF Received (net) (1) 0.26 0.16 0.04 0.10 0.01 0.36 0.01 0.14 0.08 (0.04) 0.01 (0.01)
Community Operating Costs (2) (0.29) (0.30) (0.31) (0.57) (0.48) (0.50) (0.28) (0.32) (0.25) (0.34) (0.39) (0.11) (0.14)
Net result from utilities 0.01 0.02 0.03 0.02 (0.04) 0.01 0.01 (0.02)
0.02 (0.02)
Net Annuity Cash Flows 1.02 0.53 0.68 0.63 0.78 0.78 0.45 0.57 0.60 0.39 0.47 (0.14) (0.14)
Head Offjce Costs (4.08) Net Operating Cash Flows (19.16) Reconciliation to statutory cash fmows Less - Interest (1.33) Less - Income taxes paid (3.61) Add - Land (investing cash fmow) 20.84 Add - Movement in working capital (2.21) Statutory Cash Flows from Operations ($million) (5.48) Notes: (1) Deferred management fees received are inclusive of selling and administration fees as well as wages and marketing costs (2) Lifestyle Communities record 100% rental income and pay out 50% (after management fees) to non-controlling interests (3) 50% of development cash fmows for joint venture are refmected above
1HFY19
33
LIFESTYLE COMMUNITIES LIMITED A BUSINESS FOR PURPOSE
Notes: (1) Deferred management fees received are inclusive of selling and administration fees as well as wages and marketing costs (2) Lifestyle Communities record 100% rental income and pay out 50% (after management fees) to non-controlling interests (3) 50% of development cash fmows for joint venture are refmected above
1HFY18
Supplementary Cash Flow Analysis for 1HFY18 Brookfield Seasons Warragul Casey Fields(3) Shepparton Chelsea Heights(3) Hastings Lyndarum Geelong Officer Berwick Waters Bittern Ocean Grove Mount Duneed Kaduna Park Total Total Number of Homes 228 136 182 217 301 186 141 154 164 151 216 209 220 191 165 2,827 Settled 1HFY18
22 22 51
Remaining homes available to settle
56 4 153 208 193 189 160 1,050 Development Cash Flows ($million) Land
(1.30) Development Expenditure (development and sales)
(0.99) (0.46) (6.51) (4.46) (1.52) (0.02)
Home Construction
(3.67) (0.13) (10.22) (0.04) (0.04)
Home Settlements
6.52 7.29 17.02
Net Development Cash Flows
1.86 6.70 0.29 (4.50) (1.56) (0.02) (1.30) 10.30 Annuity Cash Flows ($million) Site Rentals (incl. Management Fees) 1.08 0.66 0.89 1.06 1.02 0.90 0.70 0.66 0.47 0.67
DMF Received (net)(1) 0.41 (0.07) 0.17 0.37 0.06 0.26 0.16
Community Operating Costs (0.29) (0.29) (0.32) (0.82) (0.41) (0.66) (0.26) (0.26) (0.20) (0.25) (0.14) (0.02) (0.02)
Net result from utilities 0.01 0.01 0.02 0.01 0.04 0.03 (0.01) (0.01) (0.01) (0.03) (0.02)
Net Annuity Cash Flows 1.22 0.31 0.76 0.64 0.72 0.53 0.59 0.39 0.25 0.39 (0.16) (0.02) (0.02)
Head Offjce Costs (3.22) Net Operating Cash Flows 12.68 Reconciliation to statutory cash fmows Less – Interest (0.92) Less – Income tax paid (2.75) Add – Land (investing cash fmow) 1.30 Less – Movement in inventory and creditors (2.13) Statutory Cash Flows from Operations ($million) 8.17
34
LIFESTYLE COMMUNITIES LIMITED A BUSINESS FOR PURPOSE
Important notice and disclaimer
background information about Lifestyle Communities Limited (LIC) and its activities current at 21 February 2019 unless otherwise stated.
not purport to be complete. It should be read in conjunction with LICs other periodic and continuous disclosure announcements lodged with the Australian Securities Exchange, which are available at www.asx.com.au.
extent permitted by law, no representation
to the fairness, accuracy, completeness or correctness of the information, opinions and conclusions in this presentation and LIC, its directors, offjcers, employees, agents and advisers disclaim all liability and responsibility (including for negligence) for any direct
sufgered by any recipient through use or reliance on anything contained in or omitted from this presentation.
Presentation is given for illustrative purposes
not) an indication of future performance.
looking statements” and prospective fjnancial information. These forward looking statements and information are based on the beliefs of LICs management as well as assumptions made by and information currently available to LICs management, and speak only as of the date of this presentation. All statements other than statements of historical facts included in this presentation, including without limitation, statements regarding LICs forecasts, business strategy, synergies, plans and objectives, are forward- looking statements. In addition, when used in this presentation, the words “forecast”, “estimate”, “expect”, “anticipated” and similar expressions are intended to identify forward looking statements. Such statements are subject to signifjcant assumptions, risks and uncertainties, many of which are outside the control of LIC and are not reliably predictable, which could cause actual results to difger materially, in terms of quantum and timing, from those described herein. Readers are cautioned not to place undue reliance on forward-looking statements and LIC assumes no obligation to update such information.
subject to change without notice.
the foregoing restrictions and limitations.
release in the United States or to, or for the account or benefjt of, US persons.
35
LIFESTYLE COMMUNITIES LIMITED A BUSINESS FOR PURPOSE LIFESTYLE COMMUNITIES LIMITED
Level 2, 25 Ross Street South Melbourne VIC 3205 Ph: (03) 9682 2249
www.lifestylecommunities.com.au