
SLIDE 1
A Billion Dollar Problem!!! A Billion Dollar Problem!!! Water borne - - PowerPoint PPT Presentation
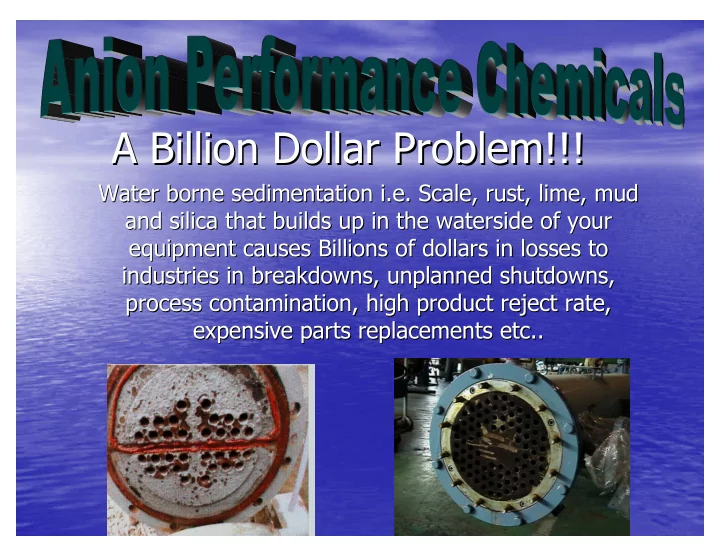
A Billion Dollar Problem!!! A Billion Dollar Problem!!! Water borne sedimentation i.e. Scale, rust, lime, mud Water borne sedimentation i.e. Scale, rust, lime, mud and silica that builds up in the waterside of your and silica that builds up in
Scale is most visually evident as hard white to off white deposits which build-up in faucets, showerheads and drains. Scale leaves deposits
dishes, glassware, sinks, countertops and on vehicles that were just washed. Most scale formations are hard and very difficult to clean. Visual references also include fixtures such as toilets, bathtubs, showers and appliances like coffee and icemakers. Swimming pools and spas can experience scale build up on tile and pump equipment. Cooling towers have tremendous scale problems that causes industries alone a billion dollars a year to remove. Evaporative coolers, boilers, car washes, irrigation systems, processing equipment, paper pulp mills all experience scale problems. Because scale forms a "coating" it can significantly effect thermo-transfer and reduce the flow of
astronomical.
What is fouling? What is fouling?
Fouling is generally defined as the accumulation of unwanted Fouling is generally defined as the accumulation of unwanted materials on the surfaces of processing equipment. It has materials on the surfaces of processing equipment. It has been recognised as a nearly universal problem in design and been recognised as a nearly universal problem in design and
ways: ways:
The fouling layer has a low thermal conductivity. This increases the resistance to heat transfer and This increases the resistance to heat transfer and reduces the effectiveness of heat exchangers reduces the effectiveness of heat exchangers – – increasing temperature increasing temperature
As deposition occurs, the cross-
sectional area is reduced, which causes an increase in reduced, which causes an increase in pressure pressure drop drop across the apparatus across the apparatus
Despite the enormous costs associated with fouling, only very Despite the enormous costs associated with fouling, only very limited research has been done on this subject. Reliable knowled limited research has been done on this subject. Reliable knowledge ge
fouling economics is important when evaluating the cost
fouling economics is important when evaluating the cost efficiency of various mitigation strategies. The total fouling efficiency of various mitigation strategies. The total fouling-
related cost can be broken down into four main areas: cost can be broken down into four main areas:
Capital expenditure, which includes excess surface area (10 area (10-
50%, with an average around 35%), costs for stronger foundations, provisions for extra space, for stronger foundations, provisions for extra space, increased transport and installation costs increased transport and installation costs
Extra fuel costs, which arise if fouling leads to extra fuel burning in furnaces or boilers or if more extra fuel burning in furnaces or boilers or if more secondary energy such as electricity or process secondary energy such as electricity or process steam is needed to overcome the effects of fouling steam is needed to overcome the effects of fouling
Production losses during planned and unplanned plant shutdowns due to fouling. These are often plant shutdowns due to fouling. These are often considered to be the main costs of fouling and are considered to be the main costs of fouling and are very difficult to estimate very difficult to estimate
According to Pritchard and Thackery (Harwell Laboratories), abou According to Pritchard and Thackery (Harwell Laboratories), about 15% of t 15% of the maintenance costs of a process plant can be attributed to he the maintenance costs of a process plant can be attributed to heat at exchangers and boilers, and of this, half is probably caused by exchangers and boilers, and of this, half is probably caused by fouling fouling Fouling can be very costly in refinery and petrochemical plants Fouling can be very costly in refinery and petrochemical plants since it increases fuel usage, results in interrupted operation since it increases fuel usage, results in interrupted operation and and production losses, and increases maintenance costs production losses, and increases maintenance costs. Panchal . Panchal (Argonne National Laboratory), based on the study of Van Nostran (Argonne National Laboratory), based on the study of Van Nostrand, re d, re-
estimated the energy and economic penalties associated with heat exchanger fouling for the US refineries, as more than exchanger fouling for the US refineries, as more than $2 billion per $2 billion per year year. . The maintenance costs in the USA were revised because they have The maintenance costs in the USA were revised because they have increased significantly due to recent environmental regulations. increased significantly due to recent environmental regulations. Typically, Typically, cleaning costs are in the range of $40,000 to $50,000 per heat e cleaning costs are in the range of $40,000 to $50,000 per heat exchanger xchanger per cleaning per cleaning Garrett Garrett-
Price and Pritchard found that total heat exchanger fouling costs s for highly industrialised countries such as the US and the UK ar for highly industrialised countries such as the US and the UK are about e about 0.25% of the countries 0.25% of the countries’ ’ gross national product (GNP). Steinhagen et al gross national product (GNP). Steinhagen et al found that the fouling costs for New Zealand are 0.15% of the Ne found that the fouling costs for New Zealand are 0.15% of the New w Zealand GNP, which is less than for industrialised countries. Us Zealand GNP, which is less than for industrialised countries. Using these ing these percentages, M percentages, Mü üller ller-
Steinhagen lists total fouling related costs for various countries based on 1992 US$. countries based on 1992 US$. -
NEXT PAGE figure 1
Energy Is by Far the Largest Component of the Total Life Cycle Energy Is by Far the Largest Component of the Total Life Cycle Cost of Most Energy Cost of Most Energy-
using Equipment
The evidence above shows that fouling on the waterside of your e The evidence above shows that fouling on the waterside of your equipment will quipment will increase your energy cost tremendously. Current methods
increase your energy cost tremendously. Current methods
maintenance/cleaning would not be able to address this problem a maintenance/cleaning would not be able to address this problem as equipment s equipment is not cleaned to bare metal and fouling is spread over a large is not cleaned to bare metal and fouling is spread over a large surface area surface area A good proactive/predictive maintenance programme, with regards A good proactive/predictive maintenance programme, with regards to to waterside fouling, reduces unplanned shutdowns, astronomical ene waterside fouling, reduces unplanned shutdowns, astronomical energy and rgy and
imum
hangers is reduced with the increase in thermal resistance; even a minute l reduced with the increase in thermal resistance; even a minute layer of fouling ayer of fouling reduces thermal conductivity. Due to the; reduces thermal conductivity. Due to the; 1. 1. Introduction of new water continuously, Introduction of new water continuously, 2. 2. Existing fouling in the piping system, Existing fouling in the piping system, Fouling cannot be avoided in everyday situations, it can only be Fouling cannot be avoided in everyday situations, it can only be minimised minimised
Two basic and effective ways to reduce energy costs that apply t Two basic and effective ways to reduce energy costs that apply to all
energy production, distribution and end energy production, distribution and end-
use categories are
1. 1. To reduce the load or need for energy To reduce the load or need for energy 2. 2. Increase the operating efficiency of energy Increase the operating efficiency of energy-
using equipment
Energy Increase in Relation to Scale Thickness
Extra Energy Required
Scale in mm REFERENCES : REFERENCES : Beebe, Ray (1995) Beebe, Ray (1995) Machine Condition Monitoring Machine Condition Monitoring MCM Consultants (1995 Reprint) ISBN 0646250884 MCM Consultants (1995 Reprint) ISBN 0646250884 Beebe, Ray (1998) C Beebe, Ray (1998) Condition Monitoring by Performance Analysis to Optimise Time for
Overhaul of Centrifugal Pumps Centrifugal Pumps Mfptsociety 52 Mfptsociety 52nd
nd Conference
Conference Eryurek, E and Warrior, J (1997) Eryurek, E and Warrior, J (1997) Smart Field Devices Improve Process Anomaly Detection Smart Field Devices Improve Process Anomaly Detection Rosemount Inc Rosemount Inc Technical Paper Technical Paper Haynes, C J and Fitzgerald, M A (1986) Haynes, C J and Fitzgerald, M A (1986) Scheduling Power Plant Maintenance Using Performance Data Scheduling Power Plant Maintenance Using Performance Data ASME ASME Paper 86 Paper 86-
jpgc-
pwr-
63 Pritchard and Thackery (Harwell Laboratories Pritchard and Thackery (Harwell Laboratories Panchal (Argone National Laboratory) Panchal (Argone National Laboratory)
Maintenance Strategy Technique Needed Human Body Parallel Proactive Maintenance
Monitoring and correction of failing root causes, e.g. removal of water based scale with Anion D’Scale
Cholesterol and blood pressure monitoring with diet control Predictive Maintenance Monitoring of vibration, heat, alignment, wear debris Detection of heart disease using EKG or ultrasonics Preventive Maintenance Periodic component replacement By-pass or transplant surgery Breakdown Maintenance Large maintenance budget Heart attack or stroke
Recommended to change every 5 to 6 years - 200hp Compressor -
HOURS
SUPERIOR CORROSION INHIBITORS. YOUR EQUIPMENT WILL NOT BE HARMED!
SOLUBLE SEDIMENTATION.
ENVIRONMENT (SPENT PRODUCT)
PERSONNEL
SHUTDOWNS, EXPENSIVE REPAIRS, REDUCES ENERGY AND OPERATIONAL COSTS AND WILL EXTEND THE LIFESPAN OF YOUR EQUIPMENT!
High Pressure Cylinder Aftercooler Intercooler Low Pressure Cylinder Anion D’Scale In Anion D’Scale Out
Recirculation Pump
Because Anion D'SCALE does not corrode, pit, erode or have any other harmful effects on materials and metals such as; STEEL, IRON, BRASS, COPPER, PLASTIC, FIBER, TEFLON or other metals or materials found in water-based systems or equipment, you can clean your equipment IN-SITU (and sometimes without shutting down the machine).
Welding Guns and hoses checked by Ford Personnel after cleaning - now
to maintain problem free production. Also, specialized hoses costs them an inordinate amount of money. Now these hoses do not have to be changed as
MAAG Oil Cooler - 10 Feet Length x 1 Foot Diameter
MAAG Oil Cooler - 10 Feet Length x 1 Foot Diameter
Shangri La Hotel Shangri La Hotel -
Complete Water Side Cleaning of High Pressure Steam Washer Heat Exchanger High Pressure Steam Washer Heat Exchanger
Heat Exchanger to be cleaned Scorched paint due to overheating
mud.
Shangri La Hotel - Complete water side cleaning of Heat Exchanger (High pressure steam washer)
Observations: The tube side is seen to be coated with a thick layer of rust, scale & mud. This would have tremendously retarded thermal transfer efficiency, causing extremely high operating costs and damage & eventual breakdown of the heat exchanger. Some tubes were partially clogged. Due to the age of the machine and the probable bad condition of the shell cover seals, the shell cover was not opened for a full view of the tube bundle. Because of this even manual cleaning could not be performed. After 1 1/2 hours of circulation with Anion D'SCALE, it can be clearly seen that the tube bundle has been cleaned to bare
Before After
Cleaned to bare
tubes can be seen
MAAG Oil Cooler - 10 Feet Length x 1 Foot Diameter - They could not believe
They could not believe that it was back to brand new condition and glowing in the dark! that it was back to brand new condition and glowing in the dark!! !
B) Your Downtime For Unnecessary Breakdowns B) Your Downtime For Unnecessary Breakdowns
Domino effect C) Prevent Unnecessary Accidents to Personnel C) Prevent Unnecessary Accidents to Personnel
Conventional Methods require lifting, handling and dismantling heavy equipment. Many still use industrial acid which is harmful heavy equipment. Many still use industrial acid which is harmful to to personnel & environment. personnel & environment. D) Energy Cost D) Energy Cost -
as Illustrated Earlier E) Efficient & Uninterrupted Production and Quality E) Efficient & Uninterrupted Production and Quality -
example : The Cleaner The Waterside of Mould The Faster The Mould Cycle Will B Cleaner The Waterside of Mould The Faster The Mould Cycle Will Be e and Fewer Rate of Rejects. Therefore Increasing Production. and Fewer Rate of Rejects. Therefore Increasing Production. F) No Need For Excessive Spare Parts or Auxiliary Units. Also F) No Need For Excessive Spare Parts or Auxiliary Units. Also Frequent Changing Of To New Parts In Older Equipment Has High Frequent Changing Of To New Parts In Older Equipment Has High Infant Mortality Rate, Leading to More Downtime! Infant Mortality Rate, Leading to More Downtime! G) Prolongs The Lifespan Of Your Equipment. Proper Asset G) Prolongs The Lifespan Of Your Equipment. Proper Asset Management Thus Reducing Capital Cost Management Thus Reducing Capital Cost
Twin Coil WCPU was cleaned. (1 1/2 hours). Air conditioning was warm prior to cleaning. As can be seen from the water inlet clogging, the coils would have been badly clogged as well. Since there was insufficient heat transfer, condensation of the R22 gas was not taking place. Eventually the compressors (2 units) will have to be replaced (a couple thousand USD each). Cleaning every 6 to 8 months will ensure continuous chilled air and will prolong the lifespan of the compressors and the coils.