
SLIDE 1
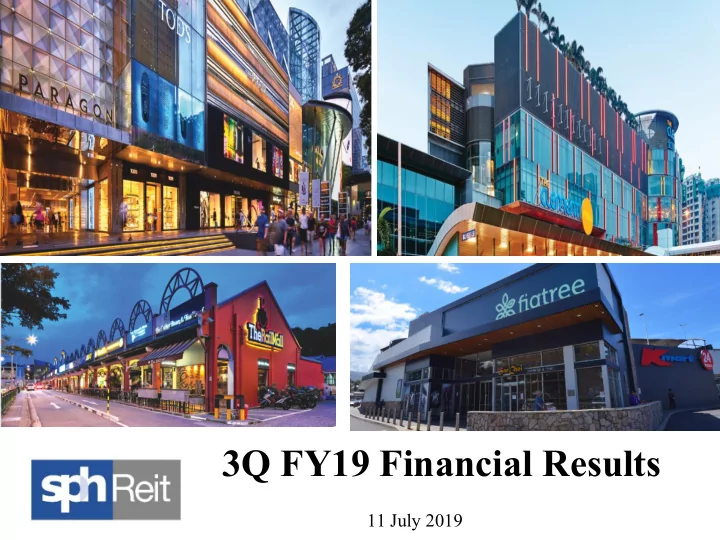
3Q FY19 Financial Results
11 July 2019
3Q FY19 Financial Results 11 July 2019 Disclaimer This - - PowerPoint PPT Presentation
3Q FY19 Financial Results 11 July 2019 Disclaimer This presentation is for information only and does not constitute an invitation or offer to acquire, purchase or subscribe for units in SPH REIT (Units) . The value of Units and the income
11 July 2019
This presentation is for information only and does not constitute an invitation or offer to acquire, purchase or subscribe for units in SPH REIT (“Units”). The value
is subject to investment risks, including the possible loss of the principal amount invested. The past performance of SPH REIT is not necessarily indicative of its future performance. This presentation may also contain forward-looking statements that involve risks and
those expressed in forward-looking statements as a result of a number of risks, uncertainties and assumptions. Representative examples of these factors include (without limitation) general industry and economic conditions, interest rate trends, cost of capital and capital availability, competition from similar developments, shifts in expected levels of property rental income, changes in operating expenses, including employee wages, benefits and training, property expenses and governmental and public policy changes and the continued availability of financing in the amounts and the terms necessary to support future business. You are cautioned not to place undue reliance on these forward-looking statements, which are based on current view of management on future events. This presentation shall be read in conjunction with SPH REIT’s financial results for the third quarter and year-to-date ended 31 May 2019 in the SGXNET announcement.
1
Results highlight Slide 3 Balance sheet Slide 8 Operational performance Slide 11 Growth strategy and market outlook Slide 17 Distribution details and timetable Slide 22
2
2019
3
3Q FY19 Financial performance: Operational performance :
3Q FY19 S$’000 3Q FY18 S$’000 Change % Gross revenue 58,333 51,769 12.7 Property expenses (12,005) (11,210) (7.1) Net property income (NPI) 46,328 40,559 14.2 Income available for distribution 36,794 35,095 4.8 Distribution to Unitholders(b) 35,953 35,205 2.1 Distribution per unit (DPU) (cents) 1.39 1.37 1.5
4 Note: (a) Included the contributions from The Rail Mall (acquired on 28 June 2018) and Figtree Grove Shopping Centre (acquired on 21 December 2018).
(a)
YTD 3Q FY19 S$’000 YTD 3Q FY18 S$’000 Change % Gross revenue 170,261 158,840 7.2 Property expenses (36,292) (33,823) (7.3) Net property income (NPI) 133,969 125,017 7.2 Income available for distribution 109,668 107,734 1.8 Distribution to Unitholders(b) 106,995 105,532 1.4 Distribution per unit (DPU) (cents) 4.14 4.11 0.7
5 Note: (a) Included the contributions from The Rail Mall (acquired on 28 June 2018) and Figtree Grove Shopping Centre (acquired on 21 December 2018). (b) For 3QFY19, the distribution to unitholders was 97.6% of income available for distribution.
(a)
Portfolio Paragon The Clementi Mall The Rail Mall Figtree Grove Shopping Centre
125.0 101.9 23.1
101.8 23.6 3.0 5.6
Net Property Income
80 120 160 200
Portfolio Paragon The Clementi Mall The Rail Mall Figtree Grove Shopping Centre
158.8 127.8 31.0
127.9 31.3 3.7 7.4
Million
Gross Revenue
6
Note: * Included the contribution from The Rail Mall (acquired on 28 June 2018) ^ Included the contribution from Figtree Grove Shopping Centre (acquired on 21 December 2018) ^ ^ * *
7
1.34 1.40 1.37 1.43 1.34 1.41 1.39
0.80 1.20 1.60 1Q FY18 2Q FY18 3Q FY18 4Q FY18 1Q FY19 2Q FY19 3Q FY19 Cents
Unsaved Document / 23/04/2013 / 09:00
8
As at 31 May 2019 S$’000 As at 31 August 2018 S$’000 Total assets 3,615,792 3,408,034 Total liabilities 1,174,803 969,087 Net assets attributable to unitholders 2,440,989 2,438,947 Net asset value per unit S$0.94 S$0.95 Gearing (b) 30.1% 26.3%
Note: (a) Included the contributions from The Rail Mall (acquired on 28 June 2018) and Figtree Grove Shopping Centre (acquired on 21 December 2018). (b) Gearing is computed based on total debt/ total assets (Includes SPH REIT’s proportionate share of borrowings in accordance to the Property Funds Appendix ). 9
9
(a)
staggered debt maturity profile without major concentration of debts maturing in any single year.
10
10
Unsaved Document / 23/04/2013 / 09:00
11
12
renewed leases cumulatively for YTD FY19. This represented 21.4% of Paragon’s net lettable area.
FY18 for Singapore Assets.
Number of renewals / new leases NLA renewed / new leases (sqft) As a %
NLA Change compared to preceding rental rates
Paragon 81 153,129 21.4% 8.6% The Clementi Mall 17 19,664 10.1% 5.8% The Rail Mall 9 10,532 21.2% 9.1% SPH REIT Portfolio 107 183,325 19.1%
(b)(e)
8.4%
(d) Notes: (a) For expiries in 3Q FY19, excluding newly created and reconfigured units (b) As a % of SPH REIT Singapore portfolio‘s total Net Lettable Area (“NLA”) of 962,009 sqft as at 31 May 2019. (c) The change is measured between average rents of the renewed & new lease terms and the average rents of the preceding lease terms. Preceding leases were typically committed three years ago. (d) Reversion rate is computed based on weighted average of all expiring leases. (e) No new leases executed for Figtree Grove Shopping Centre in 3Q FY19.
13 (c) (a)
Weighted Average Lease Expiry (WALE) as at 31 May 2019 Singapore Portfolio Australia Portfolio By NLA 1.8 years 7.6 years By Gross Rental Income 1.9 years 5.3 years
14
Lease expiry as at 31 May 2019 FY2019 FY2020 FY2021 FY2022 FY2023 and beyond Expiries as a %
5.7% 28.8% 30.4% 17.6% 17.5% Expiries as a %
income 11.2% 23.2% 20.7% 17.3% 27.6%
0.6% 26.4% 42.8% 21.5% 8.7% FY2019 FY2020 FY2021 FY2022 FY2023 & beyond 0.1% 29.5% 36.9% 23.9% 9.6% FY2019 FY2020 FY2021 FY2022 FY2023 & beyond
15
1.0% 70.0% 18.5% 10.5% FY2019 FY2020 FY2021 FY2022 1.0% 71.3% 17.4% 10.3% FY2019 FY2020 FY2021 FY2022 41.2% 20.2% 29.6% 9.0% FY2019 FY2020 FY2021 FY2022 57.3% 14.7% 21.2% 6.8% FY2019 FY2020 FY2021 FY2022
16
Figtree Grove Shopping Centre - Completed Acquisition of 85% stake on 21 December 2018
22.0% 8.9% 7.0% 13.3% 48.8% FY2019 FY2020 FY2021 FY2022 FY2023 & beyond
Lease expiry by Gross Rental Income
14.1% 4.1% 5.4% 13.8% 62.6% FY2019 FY2020 FY2021 FY2022 FY2023 & beyond
Expiry by NLA
Unsaved Document / 23/04/2013 / 09:00
17
Proactive asset management and asset enhancement strategy
Ensure that interests of all stakeholders, including tenants,
shoppers and Unitholders are protected while keeping its properties at the forefront of evolving retail mall trends and relevant to changing demands of consumers
Continually optimise tenant mix of its properties Deliver high quality service to tenants and become the landlord
Implement asset enhancement initiatives and implement pro-
active marketing plans Investments and acquisition growth strategy
ROFR on the Sponsor’s future income-producing properties
used primarily(1) for retail purposes in Asia Pacific − One applicable ROFR property, The Seletar Mall, which has
28 November 2014, and maintained high
REIT’s portfolio and improve returns to Unitholders
Note: (1) ‘primarily’ means more than 50.0% of net lettable area or (in the case of a property where the concept of net lettable area is not applicable) gross floor area.
18
19
Paragon Level 3 Launch Celebrations – A refresh shopping space where shoppers can shop effortlessly through various shops and join us in creative workshops.
20
1.2% year-on-year in first quarter of 2019.
Against the backdrop of slightly weaker external economic outlook, MTI expects the economic growth forecast in 2019 to be narrowed downwards to “1.5% to 2.5%” from “1.5% to 3.5%”.
compared to a decline of 0.4% y-o-y in Q4 2018.
21
2.80% in 2018.
adjusted retail turnover rose by 0.3% in March 2019, 0.9% in February 2019 and 0.1% in January 2019.
Distribution period 3Q FY19 (1 March 2019 – 31 May 2019) Distribution per unit 1.39 cents per unit Ex-date 18 July 2019 Record date 19 July 2019 Payment date 22 August 2019
22
Please visit www.sphreit.com.sg for more information.
23