
28.09.2012 1
- !
- "
- #
- 00
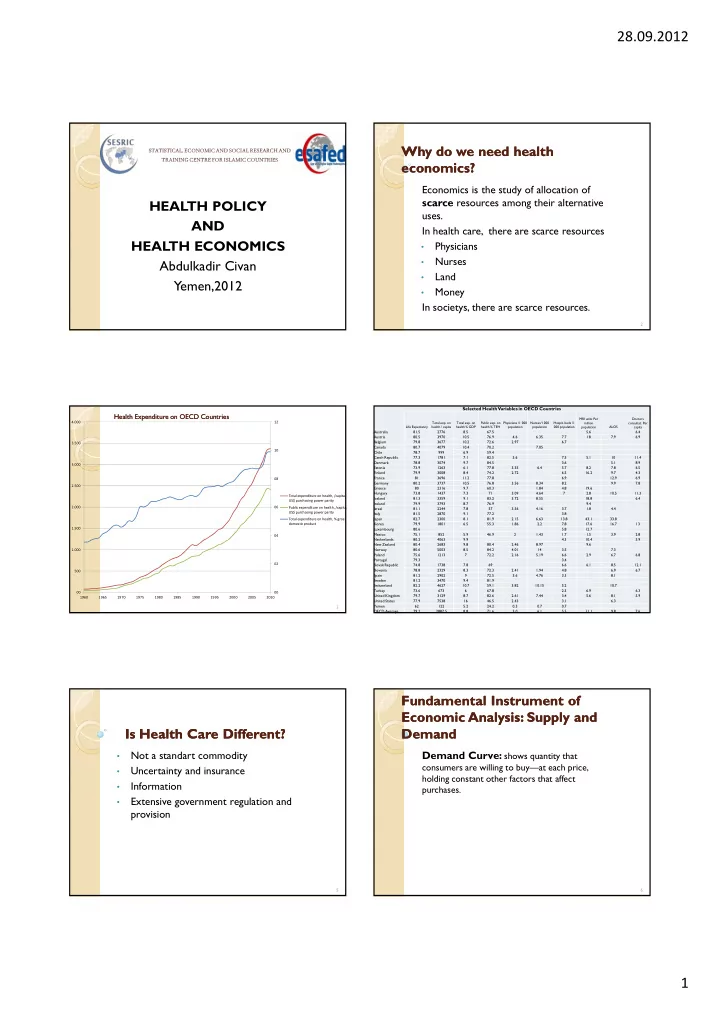
02 04 06 08 10 12 00 500 1.000 1.500 2.000 2.500 3.000 3.500 4.000 1960 1965 1970 1975 1980 1985 1990 1995 2000 2005 2010 Total expenditure on health, /capita, US$ purchasing power parity Public expenditure on health, /capita, US$ purchasing power parity Total expenditure on health, % gross domestic product
$ $ %& %& '( '(
- )
- ! "#
"%& *%& +& *%& ,-( %& ,*$ + && !+ && $&+ && #.
- &&
"'/ ( &
- 01
223 01 321 13 34
- 01
)52 1 235 43 3)1 22 25 35 6 250 )322
- 23
52 32
- 02
425 4 2 21
- 202
555 35 154 7.& 22) 20 2 01 )3 2) 1
- 4
( 200 )24 52 041 )3 1 05
- 2)5
3) 3 220 ))1 34 12 20 31 8 255 )0 04 24 2 31 3 52 4) 8 )353
- 220
35 5 35
- )2)2
1 230 )13 0)4 55 20
- )3
52 3) 04 40 53 $ 2)0 4)2 2) 2 )5 434 2 1 )
- 0)
))15 5 0) )2 011 00 34
- 255
)25) 02 235 54
- 44
20 12 )13 43 )2 44
- 01
02 5 22 )0 9& 02 ) 05 1 33) )0 4) ))0 : 255 31 11) 03
- 20
23 32 ) "% 03 10 2 #% 21 01 15 435
- 4)
2 1 )5 ! 43) 55 4) 4 15 !;< 04 30) 50 04 43 052 53 !; 03 1) 01 04 4 4 )1 2)
- 213
) 2 2 3 15 33 5 32 30
- 25)
)4 /.& 240 2)0 20 35 33 3 01
- /
200 )5 0) 2) 4 54 40 35 32 /& 5 5 21 )3 423 )) /; )42 54 05 /;7 432 2 15 )0 1 1 2 * 2)3 32) 3 320 ) 35 3) =: 252 )5 02 03 3 244 )4 13 15 =/ 225 21)0 3 431 4) ) 3)
- 3
- 1
4 ) 2 2 '( 25 0021 00 23 ) 3 11
- 50
23
$$ $$
- !
- =
- %
&
1
%# #$ %# #$ &#'' &#''
- # (&; >
;?&
- &
3