
SLIDE 1
21/02/2012 1 CKD & Nutrition: Role of protein intake & phosphate levels
Denis Fouque University of Lyon France
Current & future management of chronic kidney disease
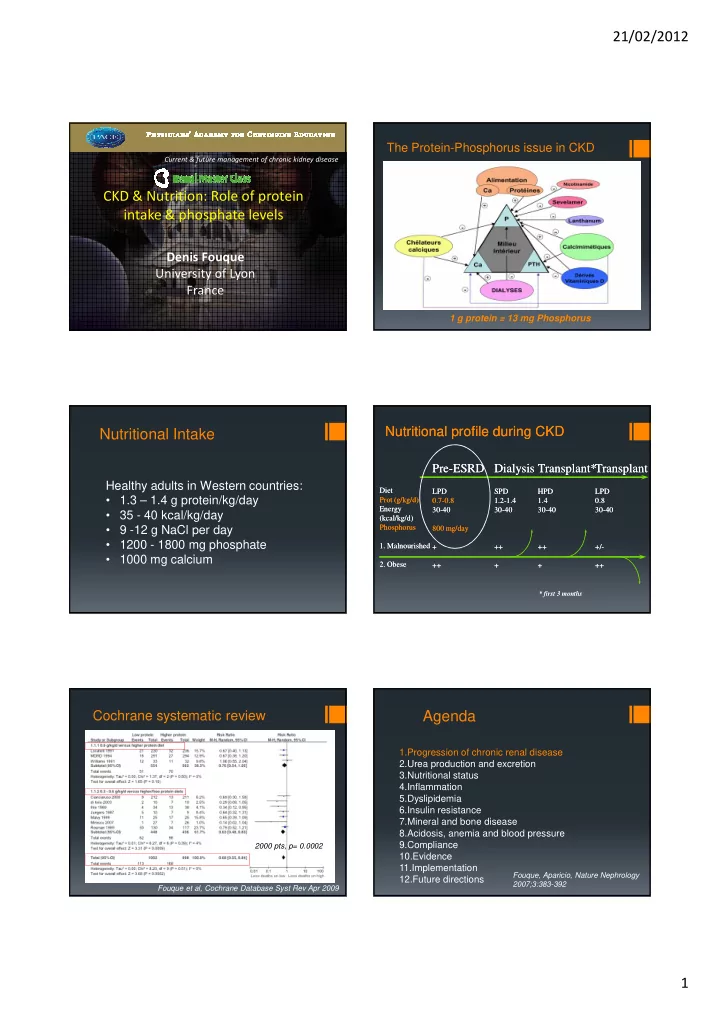
The Protein-Phosphorus issue in CKD
1 g protein = 13 mg Phosphorus
Nutritional Intake
Healthy adults in Western countries:
- 1.3 – 1.4 g protein/kg/day
- 35 - 40 kcal/kg/day
- 9 -12 g NaCl per day
- 1200 - 1800 mg phosphate
- 1000 mg calcium
Nutritional profile during CKD Nutritional profile during CKD
Pre Pre-ESRD ESRD
LPD LPD 0.7 0.7-
- 0.8
0.8 30 30-
- 40
40 800 mg/day 800 mg/day + ++ ++
Transplant* Transplant*
HPD HPD 1.4 1.4 30 30-
- 40
40 ++ ++ + +
Dialysis Dialysis
SPD SPD 1.2 1.2-
- 1.4
1.4 30 30-
- 40
40 ++ ++ + +
* first 3 months * first 3 months
Transplant Transplant
LPD LPD 0.8 0.8 30 30-
- 40
40 +/ +/-
- ++
++ Diet Diet Prot Prot (g/kg/d) (g/kg/d) Energy Energy (kcal/kg/d (kcal/kg/d) ) Phosphorus Phosphorus
- 1. Malnourished
- 1. Malnourished
- 2. Obese
- 2. Obese
Cochrane systematic review
Fouque et al, Cochrane Database Syst Rev Apr 2009 2000 pts, p= 0.0002
1.Progression of chronic renal disease 2.Urea production and excretion 3.Nutritional status 4.Inflammation 5.Dyslipidemia 6.Insulin resistance 7.Mineral and bone disease 8.Acidosis, anemia and blood pressure 9.Compliance 10.Evidence 11.Implementation 12.Future directions
Agenda
Fouque, Aparicio, Nature Nephrology 2007;3:383-392