2020 Projections were then developed by 2020 Projections were then - - PowerPoint PPT Presentation

2020 projections were then developed by 2020 projections
SMART_READER_LITE
LIVE PREVIEW

2020 Projections were then developed by 2020 Projections were then - - PowerPoint PPT Presentation

2020 Projections were then developed by 2020 Projections were then developed by aggregating segments into major mail classes aggregating segments into major mail classes Volume Forecast Key drivers Volume Forecast Key drivers Fall to approx.


slide-1
SLIDE 1

2020 Projections were then developed by aggregating segments into major mail classes 2020 Projections were then developed by aggregating segments into major mail classes

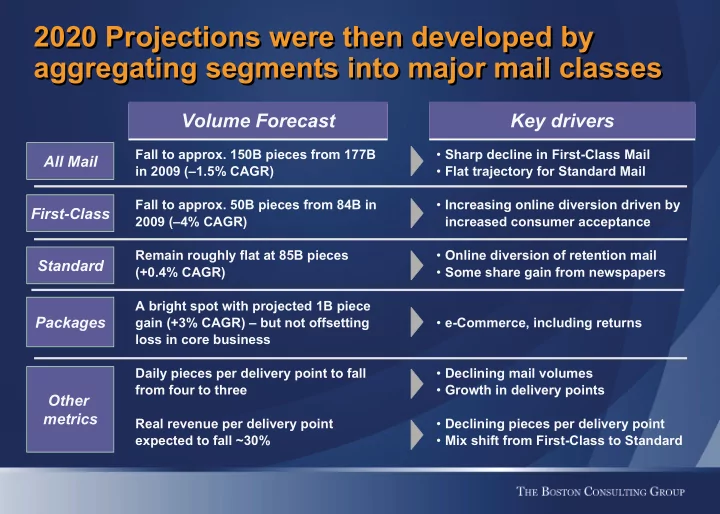
Volume Forecast Volume Forecast

Fall to approx. 150B pieces from 177B in 2009 (–1.5% CAGR) Fall to approx. 50B pieces from 84B in 2009 (–4% CAGR) Remain roughly flat at 85B pieces (+0.4% CAGR) A bright spot with projected 1B piece gain (+3% CAGR) – but not offsetting loss in core business Daily pieces per delivery point to fall from four to three Real revenue per delivery point expected to fall ~30%

Key drivers Key drivers

  • Sharp decline in First-Class Mail
  • Flat trajectory for Standard Mail
  • Increasing online diversion driven by

increased consumer acceptance

  • Online diversion of retention mail
  • Some share gain from newspapers
  • e-Commerce, including returns
  • Declining mail volumes
  • Growth in delivery points
  • Declining pieces per delivery point
  • Mix shift from First-Class to Standard

All Mail First-Class Standard Packages Other metrics

slide-2
SLIDE 2

We project a volume decline of at least 15% by 2020 vs. 2009 We project a volume decline of at least 15% by 2020 vs. 2009

  • 1. Sender view

2020 projection represents 30% decline off of 2006 peak

213 177 150 (-15%) 138 (-22%) 118 (-34%)

Sender View Consumer View Worst-case broadband benchmark (EU leader)

Fiscal year

120 140 160 180 200 220 Pieces (B)

2000 2002 2004 2006 2008 2010 2012 2014 2016 2018 2020

slide-3
SLIDE 3

53 (-37%) 44 (-47%)

2020 forecast sees ongoing decline in First-Class Mail 2020 forecast sees ongoing decline in First-Class Mail

Pieces (B)

Sender View Consumer View Worst-case broadband benchmark (EU leader)

Fiscal year Fiscal year

  • 1. Sender view

84 97

40 60 80 100 2000 2002 2004 2006 2008 2010 2012 2014 2016 2018 2020