
SLIDE 1
<Your Name> 1
Center for Computational Analysis of Social and Organizational Systems http://www.casos.cs.cmu.edu/
Exploring pro and anti- government movements during the 2019 Ecuadorian protests
Ramon Villa-Cox
rvillaco@andrew.cmu.edu School of Computer Science, Carnegie Mellon Summer Institute 2020
11 June 2020 2 Ramon Villa-Cox
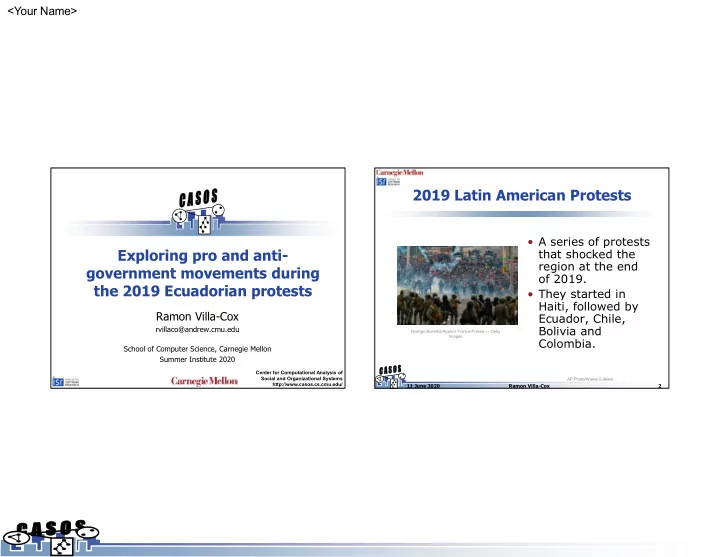
2019 Latin American Protests
Rodrigo Buendia/Agence France-Presse — Getty Images AP Photo/Ariana Cubillos
- A series of protests
that shocked the region at the end
- f 2019.
- They started in