
SLIDE 1
2017 Examiner Training and Preparation Course
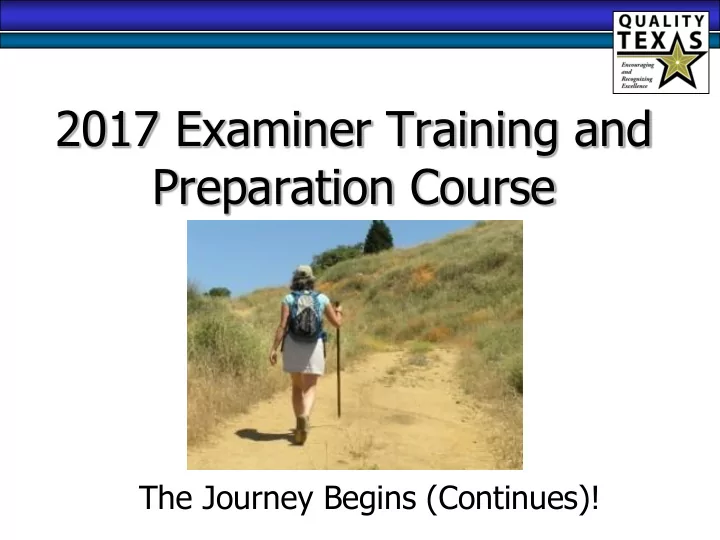
The Journey Begins (Continues)!
2017 Examiner Training and Preparation Course The Journey Begins - - PowerPoint PPT Presentation
2017 Examiner Training and Preparation Course The Journey Begins (Continues)! Before We Begin. Logistics Parking Safety Lot Location of exits Use of phone (please place on silent) Restrooms Parking Lot Quality Texas
2017 Examiner Training and Preparation Course
The Journey Begins (Continues)!
Before We Begin….
Logistics
(please place on silent)
Parking Lot
Quality Texas Meeting Behaviors
at a time
means affirmation
Ground Rules
Gain an understanding of Baldrige Framework; (organizational improvement) Apply the Six-Step Independent Review Process to an Award Application Choosing/Writing Key Factors, Strengths/OFIs, Scoring, and discussing Key Themes Write Better Feedback Comments Using the Comment Guidelines Improve your personal BRAND!
Tuesday – Quick review of the
Baldrige Framework; Review the Organizational Profile; Determine Key Factors; Discuss Six-Step IR Process; Review Items
Wednesday – Six-Step IR Process;
Review other Items
Thursday – Six-Step IR Process;
Review Results Items; Review QTF Website; Scorebook Navigator Class
Introductions
– Name / City
– Organization – Job title
Baldrige Criteria
this Training
Quality Texas Foundation
Chief Operations Officer (COO) linwrinkle@quality-texas.org; (512) 818-3901
Chief Executive Officer (CEO) drmac@quality-texas.org; (512) 656-8946 Address: 201 Woodland Park, Georgetown, Texas 78633-2007 www.quality-texas.org
QTF Organizational Chart
Board of Directors Volunteers Training Team Judges CEO/Staff
Key Facts About Quality Texas Foundation
▪ President Reagan national concept 1987-1989; Mac Baldrige, Secretary
▪ State Concept 1990; Started 1992; Endorsed by Governor Ann Richards; accepted applications 1993 ▪ Founded in 1994 as a 501(c)3 not- for-profit corporation ▪ Full-time staff of two people; around 350 state-wide volunteers; over 1,500
QTF’s Vision and Mission
Vision: Th
The e Qualit Quality y Te Texa xas s Fo Foun unda dation tion (Q (QTF TF) ) wi will ll co continu ntinue e to to be be the the pre preemine eminent nt state state p prog rogram ram ass assisti isting ng individua individuals, ls,
anizations, and izations, and co commun mmuniti ities es wi with th co continu ntinuou
s improve improvemen ment t efforts efforts.
Mission: QTF ex
QTF exists ists to to ass assist ist individua individuals, ls, o
rganiza nizations tions an and d co commun mmuniti ities es in t in the heir ir co continu ntinuou
s impro improve veme ment nt effo efforts the rts thereb reby y po positi sitively vely impac impacting ou ting our r co commun mmuniti ities, state, es, state, an and na d nation tion.
Key Facts About Quality Texas Foundation
▪ Funded through
▪ Memberships/Sponsorships, ▪ Examiner Training, ▪ Customized training workshops, ▪ Application fees, ▪ Annual Conference ▪ Recognized as the most effective state program, with more Baldrige recipients than any other state (20); 1 two-time recipient; 53 state winners
QTF’s Values, CCs, and Motto
Values:
Core Competencies:
Motto:
Services We Provide
– writing seminars; – assessment techniques; – site visit training; – Leadership seminars; – Strategic Planning events, and – Communities of Excellence (COE) Seminars
Why Organizations Apply
standardized method to examine processes and performance; objective feedback
performance
QTF Process Map
QTF Processes/Steps
Training
Applications Received
Engagement (10) Commitment (20) Progress (30) Award (50)
Teams Selected Independent Review Consensus Review Site Visit Feedback Report Judges Review Board Review Award Applicant Notified
QTF Examination Process
Strengths/OFIs; Score; Complete IR Scorebook
Category Champions; Prepare for Site Visit?
Application Levels
QTF is there for YOU and YOUR
products and services!
QTF LEVELS
Award Next Level Award Level* Progress Recognition Commitment Recognition Engagement Recognition Pioneer Recognition
Award (Achievement) Levels 50 pages + 5 (OP) Progress Level 30 pages + 5 (OP) Commitment Level 20 pages + 5 (OP) Engagement Level 10 pages + 5 (OP) Pioneer Level 5 pages (OP) Award Next 50 pages + 5 (OP)
Examiner Path
Examiners’ Roles and Responsibilities
next level of maturity; work as a team
– Examiners – Senior Examiners – Alumni Examiners – Scorebook Editor – Back-up Team Leaders – Team Leader – Process Coach
any role)
Code of Ethics, Examiner Availability, and Examiner Career Path
See Sheets for Code of Ethics and Examiner Availability (please turn in to Lin Thursday am
QTF needs YOU!
Examiner Career Path
Examiner Position
Time Experiences
Examiner
1-3 years BU TL, FBW, 1 SV, Examiner Training Each Year
Senior Examiner
4-6 years TL, 2 SV+, Examiner Training Each Year
Alumni Examiner
6+ TL, Process Coach, 3+ SV, Examiner Training Each Year Various Committees
Judge
6+ TL, Process Coach, 3+ SV, Examiner Training Each Year Various Committees
Board of Directors
6+ Corporate Sponsorship, TL, Process Coach, 3+ SV, Examiner Training Each Year Various Committees
Fellow
10+ Dedication and Continual Volunteerism for QTF Issues
Benefits of Being an Examiner
Excellence Criteria; training/experience
brand; valuable professional credential
and leadership skills
feedback (patriotism)
Conditions of Involvement
Absolute Essentials to the Credibility, Success and Prestige of the Assessment and Feedback Process
the feedback is presented to the applicant)
Value for the Examiner/Sponsor
professional friendships
to organizations; your own personal plan?
Conference – Westin Hotel, June, 2017, Houston, TX
QTF EXAMINATION & FEEDBACK PROCESS
Three Steps!
QTF EXAMINATION & FEEDBACK PROCESS
Stage 1 – Independent Review – Work done on your own – (less Pioneer) Stage 2 – Consensus Review – work done with team (less Pioneer) Stage 3 – Site Visit – on site with the applicant (if Progress or Award Level); Feedback Report
Walk Through Baldrige Framework Booklet
Take a look at your Baldrige Framework Book
Baldrige Excellence Framework
Baldrige Excellence Framework
How Do I Evaluate Process Items?
Process items are evaluated using four factors:
Approach (A)
“Approach” comprises
based on reliable data/information (i.e., systematic)
question
Deployment (D)
“Deployment” is the extent to which
requirements relevant and important to the
work units
approach
Learning (L)
Learning comprises
cycles of evaluation/improvement
breakthrough change through innovation, and,
innovation with other work units and processes in the organization
Integration (I)
“Integration” is the extent which
needs (OP/ processes)
improvement systems are complementary across processes and work units
learning, and actions are “harmonized” across processes/work units to support goals
Category 7 Examination
Results: 45% of the Total Score Category 7 Evaluated by LeTCI
Levels – Le Trends – T Comparisons – C Integration - I
Results Evaluation Factors LeTCI
improvements (slope over time)
appropriate organizations, competitors or organizations that are similar; relative to industry leaders/benchmarks
performance requirements relating to customers, products/services, markets, processes, or action plans identified in OP and in process items; future performance; harmonization across processes and work units to support organization-wide goals
Segmentation
Segments can be defined by, among other things:
▪ Customers (students/families for Education; patients/families for HC) ▪ Market/Product offerings ▪ Location ▪ Workforce group (employees, tenure, admin, hourly, etc.) ▪ Size of the group in question
The applicant defines their segments (OP – P1); we assess the results of those segments
Comparisons
Comparisons can be defined by, among other things (Organizational Profile OP – P2 Competition):
QTF/Baldrige Examination 6 Step Process
TRUST THE PROCESS! (KEY TEACHING POINT)
OP – The Preliminary Step
Forms
application
applicant says is important
applicant says is important
Step 1: Read the Criteria.
Read Baldrige Framework for Award Level QTF Pioneer, Engagement, Commitment,
Level Criteria
Step 2: Determine Most Relevant Key Factors
Four to Six Key Factors taken from OP, Eligibility, or from Application
Step 3: Read & Analyze the Application
Read the Application Mark as appropriate
Step 4: Identify Strengths/OFIs
Around 6 comments Strengths and OFIs
Step 5: Write Feedback Ready Comments
Remember: NERD!
N – nugget of
importance
E – evidence/example
to support comments
R – relevance to the
applicant
D – Done!
Step 6: Determine the Scoring Range and Score
Best Fit Don’t Block a Winner Tie goes to applicant
Scoring: Not like your previous education! Go to Process Scoring Page 34
UNDERSTANDING SYSTEMATIC APPROACH
UNDERSTANDING DEPLOYMENT
UNDERSTANDING IMPROVEMENT/LEARNING/INNOVATION
UNDERSTANDING INTEGRATION
Go to Results Scoring Page 35
What is different about Results Scoring?
Questions to this Point??
So let’s begin our Examination/Evaluation Independent Review
We will follow the exact same steps that you will follow
Preliminary Step: Importance of the Organizational Profile
application
applicant says is important
report), strengths/OFIs, scoring, and Key Themes
descriptors
How to Determine Key Factors
– OP – Eligibility Form – Application
P.1 Organizational Descriptions:
What are your key organizational characteristics?
In your response, answer the following questions:
P.1a Organizational Environment (1) Product Offerings What are your main HEALTH CARE SERVICE offerings? What is the relative importance of each to your success? What mechanisms do you use to deliver your HEALTH CARE SERVICES? (2.0, 3.0, 6.0, 7.1) (2) MISSION, VISION, and VALUES What are your stated MISSION, VISION, and VALUES? What are your organization’s CORE COMPETENCIES, and what is their relationship to your MISSION? (1.0, 2.0, 7-1-7-5)
P.1 Organizational Descriptions:
What are your key organizational characteristics?
(3) WORKFORCE What is your WORKFORCE profile? What recent changes have you experienced in WORKFORCE composition or your WORKFORCE needs? (5.0, 7.3)
the educational requirements for different employee groups and SEGMENTS, and the KEY drivers that engage them in achieving your MISSION and VISION? (1.0, 2.0, 5.0, 7.3)
What are your organization’s special health and safety requirements? (4) Assets What are your major facilities, technologies, and equipment?
6 6
P.1 Organizational Descriptions:
What are your key organizational characteristics?
(5) Regulatory Requirements What is the regulatory environment under which you
accreditation, certification, or registration requirements; industry standards; and environmental, financial, and HEALTH CARE SERVICE delivery regulations? (7.0)
P.1 Organizational Descriptions:
What are your key organizational characteristics?
(1) Organizational Structure What are your organizational structure and GOVERNANCE system? What are the reporting relationships among your GOVERNANCE board, SENIOR LEADERS, and parent organization, as appropriate? (1.0, 7.4) (2) PATIENTS, OTHER CUSTOMERS, and STAKEHOLDERS What are your KEY market SEGMENTS, PATIENT and other CUSTOMER groups, and STAKEHOLDER groups, as appropriate? What are their KEY requirements and expectations for your HEALTH CARE SERVICES, other CUSTOMER support services, and operations? What are the differences in these requirements and expectations among market SEGMENTS, PATIENT and other CUSTOMER groups, and STAKEHOLDER groups? (3.0, 7.2)
P.1 Organizational Descriptions:
What are your key organizational characteristics? (3) Suppliers and PARTNERS What are your KEY types of suppliers, PARTNERS, and COLLABORATORS? What role do they play
delivering your KEY HEALTH CARE SERVICES and PATIENT and other CUSTOMER support services; and in enhancing your competitiveness? (2.2, 3.0, 4.0, 6.0, 7.2)
with suppliers, PARTNERS, and COLLABORATORS? What role, if any, do these organizations play in contributing and implementing INNOVATIONS in your organization? What are your KEY supply-chain requirements? (3.0)
P.2 Organizational Situation:
What is your organization’s strategic situation?
P.2 Organizational Situation: What is your
response, include answers to the following questions:
(1) Competitive Position What is your competitive position? What are your relative size and growth in the health care industry or the markets you serve? How many and what types of competitors do you have? (1.0, 2.2, 7.0)
P.2 Organizational Situation:
What is your organization’s strategic situation?
(2) Competitiveness Changes What KEY changes, if any, are affecting your competitive situation, including changes that create opportunities for INNOVATION and collaboration, as appropriate? (1.0, 2.2, 7.0) (3) Comparative Data What KEY sources of comparative and competitive data are available from within your health care industry? What KEY sources of comparative data are available from outside your industry? What limitations, if any, affect your ability to
P.2 Organizational Situation:
What is your organization’s strategic situation?
ADVANTAGES in the areas of HEALTH CARE SERVICES, operations, societal responsibilities, and WORKFORCE? (1.0, 2.0, 7.0)
improvement system, including your PROCESSES for evaluation and improvement of KEY
3.0, 4.0, 5.0, 6.0, 7.0)
Exercise: Determine Key Factors
Activity Time (min) 1. Select a scribe, timekeeper and reporter (1) 2. Discuss at table as a group your thoughts on the key factors for this applicant from Organizational Profile Tables 1/9: P1a(1)(2); Tables 2/10: P1a(3)(4)(5); Tables 3/11: P1b(1)(2); Tables 4/12: P1b(2)(3); Tables 5/13: P2a(1)(2); Tables 6/14: P2a(3); Table 7: P2b; Table 8: P2c 20 3. Read and Highlight Key Factors from the OP and select a few to write down; Table Anchors guide this process
20 10 5. Report Out (1 minute per table) 5
55 Minutes Total
IR Key Factors (each Examiner)
Navigator
KF for the team to use on Scorebook Navigator before moving forward with IR
Step 1: Read the Criteria
Exercise: Step 1 Read the Criteria
Activity Time (min) 1. Select a scribe, timekeeper and reporter (1) 2. Discuss at your table, (group) your thoughts on the key requirements for your assigned Item from Baldrige Framework Table 1: 1.1; Table 2: 1.2; Table 3: 2.1; Table 4: 2.2; Table 5: 2.2; Table 6: 3.1; Table 7: 3.2; Table 8: 4.1; Table 9: 4.2; Table 10: 5.1; Table 11: 5.2; Table 12: 6.1; Table 13: 6.2; Table 14: 5.2
20 10 10 10
50 Minutes Total
Step 2: Determine Most Relevant Key Factors for Criteria
Exercise: Step 2 Determine the Most Relevant Key Factors
Activity Time (min) 1. Select a scribe, timekeeper and reporter (1) 2. Review individually your assigned Criteria Item 15 3. Discuss at your table as a group and come to agreement on the relevant 4 to 6 key factors (from Team Leaders list) for your assigned item. Table 1: 1.1; Table 2: 1.2; Table 3: 2.1; Table 4: 2.2; Table 5: 2.2; Table 6: 3.1; Table 7: 3.2; Table 8: 4.1; Table 9: 4.2; Table 10: 5.1; Table 11: 5.2; Table 12: 6.1; Table 13: 6.2; Table 14: 5.2 4. Write your selected key factors on a flip chart for use in subsequent exercises (capture key words and phrases) 20 10 5. Report Out (1 minute per table) 5
50 Minutes Total
Step 3: Read and Analyze the Application
Exercise: Step 3 Read and Analyze the Application
Activity Time (min) 1. Select a scribe, timekeeper and reporter (1) 2. Review individually your assigned Criteria Item 15 3. Discuss at your table as a group your observations on the applicant’s response against the Criteria questions. Table 1: 1.1; Table 2: 1.2; Table 3: 2.1; Table 4: 2.2; Table 5: 2.2; Table 6: 3.1; Table 7: 3.2; Table 8: 4.1; Table 9: 4.2; Table 10: 5.1; Table 11: 5.2; Table 12: 6.1; Table 13: 6.2; Table 14: 5.2 20 4. Report Out (1 minute per table?) 5
40 Minutes Total
Step 4: Identify Strengths/OFIs
Exercise: Step 4 Identify S’s/OFI’s
Activity Time (min) 1. Select a scribe, timekeeper and reporter (1) 2. Select potential S/OFIs individually. Then, use a round robin approach to discuss individual S/OFIs identified 20 3. From this list, discuss at your table and select as a group, a total of around 4/6 potential S/OFIs. Then select 2 S/OFIs that you feel are most important. Table 1: 1.1; Table 2: 1.2; Table 3: 2.1; Table 4: 2.2; Table 5: 2.2; Table 6: 3.1; Table 7: 3.2; Table 8: 4.1; Table 9: 4.2; Table 10: 5.1; Table 11: 5.2; Table 12: 6.1; Table 13: 6.2; Table 14: 5.2
25 5 5. Report Out (1 minute per table) 10
60 Minutes Total
Our Key Product
What Feedback Comments Should Do:
what it needs to improve upon to take it to the next level OFIs (opportunities for improvement)
Well-Written Comments: “NERD”
Criteria or a Key Factor (i.e., briefly connects to what the applicant says is important)
has (Strength) or is missing or not addressed (OFI)
Include actionable “so what” (not prescriptive) information; help the applicant to improve.
helps the organization understand its current status and improvement possibility
Comment Writing
Elements of a well written comment
How to Give Useful Feedback
Do:
give the comment significance
Don’t:
OFI statements
– Check your score against the balance and content of comments – Check your facts – Check grammar and spelling
Step 5: Write Feedback Ready Comments
Sample Process Strength
mechanisms (Figure 1.1-2) to communicate with the workforce and community, senior leaders deliver on a key driver of workforce
reinforce the organization’s vision, mission, and core values. Several cycles of learning have resulted in the expanded use of social media, the addition of a county director to support communication flow from senior leaders and throughout the county, and revisions to the website to enhance transparency.
Relevance Nugget Examples
Sample Process OFI
and action plans (Figure 2.1-2) do not appear to address all strategic challenges. For example, financial objectives (e.g., to decrease administrative/indirect patient costs) do not align with action plans to improve collection rates and relative value units, and no action plans align with strategic challenges related to recruiting paid staff members. The lack of alignment between strategic objectives, action plans, and strategic objectives may limit the applicant’s ability to maintain its competitive position and fulfill its mission.
Relevance Nugget Examples
Sample Results Strength
results—such as aggregate patient satisfaction, satisfaction with medical services, and satisfaction with dental services (Figures 7.2-1 through 7.2-3)—have equaled
These results reflect the applicant’s positive competitive position and support its mission to provide easy, timely access to high-quality, safe health care services responsive to diverse cultural and socioeconomic needs, regardless of ability to pay.
Relevance Nugget Examples
Sample Results OFI
applicant’s strategic challenge of staff recruitment and retention. For example, results are not provided for recruitment of health care professions and physicians; for some drivers of workforce engagement, including comfort with reporting errors or unsafe acts, protection from health and safety hazards, and a flexible work schedule; and for measures of workforce safety. Without a focus on the strategic challenge of staff recruitment and retention, patients may not be able to “become the healthiest in the state.”
Relevance Nugget Examples
Exercise: Step 5 Write Feedback Ready Comments
Activity Time (min) 1. Select a scribe, timekeeper and reporter (1) 2. Draft feedback ready S/OFI comments (split table into 2 groups; 1 feedback ready comment - S and 1 OFI) Table 1: 1.1; Table 2: 1.2; Table 3: 2.1; Table 4: 2.2; Table 5: 2.2; Table 6: 3.1; Table 7: 3.2; Table 8: 4.1; Table 9: 4.2; Table 10: 5.1; Table 11: 5.2; Table 12: 6.1; Table 13: 6.2; Table 14: 5.2 3. Give feedback to the other group and then redraft the comment, using their input 4. Record the final feedback ready comment on chart paper 25 10 10
10
55 Minutes Total
Step 6: Determine the Scoring Range and Score
Look at Scoring Guidelines in Baldrige Framework
Pages 34 Process and 35 Results
Introduction to Scoring
Guidelines
Learning, Integration (ADLI)
Levels, Trends, Comparisons, Integration (LeTCI)
8.5 6.5 8.0
Exercise: Step 6 Scoring
Activity Time (min) 1. Select a scribe, timekeeper and reporter (1) 2. Using your S/OFI comments from Step 4 and the Scoring Guidelines, discuss as a group the most appropriate scoring range for your assigned Item. Table 1: 1.1; Table 2: 1.2; Table 3: 2.1; Table 4: 2.2; Table 5: 2.2; Table 6: 3.1; Table 7: 3.2; Table 8: 4.1; Table 9: 4.2; Table 10: 5.1; Table 11: 5.2; Table 12: 6.1; Table 13: 6.2; Table 14: 5.2 15 3. Next, discuss the appropriate score within that range
and be prepared to discuss why you chose that score 10 10 5. Report Out (1 minute per table) 5 40 Minutes Total
Learnings?
Follow the Six Step Process
Complete for Category/Items as assigned to your table
QTF/Baldrige Examination 6 Step Process
TRUST THE PROCESS! (KEY TEACHING POINT)
Step 1: Read the Criteria.
Read Baldrige Framework for Award Level
Step 2: Determine Most Relevant Key Factors
Four to Six Key Factors taken from OP, Eligibility, or from Application
Step 3: Read & Analyze the Application
Read the Application Mark as appropriate
Step 4: Identify Strengths/OFIs
Around 6 comments Strengths and OFIs
Step 5: Write Feedback Ready Comments
Remember: NERD!
N – nugget of
importance
E – evidence/example
to support comments
R – relevance to the
applicant
D – Done!
Step 6: Determine the Scoring Range and Score
Best Fit Don’t Block a Winner Tie goes to applicant
What did we learn now?
QTF/Baldrige Examination 6 Step Process
TRUST THE PROCESS! (KEY TEACHING POINT)
Step 1: Read the Criteria.
Read Baldrige Framework for Award Level
Exercise: Step 1 Read the Criteria
Activity Time (min) 1. Select a scribe, timekeeper and reporter (1) 2. Review individually your assigned Criteria Item.
key requirements for your assigned Item from Baldrige Framework Table 1/6/14: 7.1; Table 2/7: 7.2; Table 3/8: 7.3; Table 4/9: 7.4; Table 5/10: 7.5; Table 6/11: 7.3; Table 7/12: 7.4; Table 8/13: 7.5
20 20 5 5
50 Minutes Total
Step 2: Determine Most Relevant Key Factors
Four to Six Key Factors taken from OP, Eligibility, or from Application
Exercise: Step 2 Determine the Most Relevant Key Factors
Activity Time (min) 1. Select a scribe, timekeeper and reporter (1) 2. Review individually your assigned Criteria Item 15
Table 1/6/14: 7.1; Table 2/7: 7.2; Table 3/8: 7.3; Table 4/9: 7.4; Table 5/10: 7.5; Table 6/11: 7.3; Table 7/12: 7.4; Table 8/13: 7.5 4. Write your selected key factors on a flip chart for use in subsequent exercises (capture key words and phrases) 20 10 5. Report Out (1 minute per table) 5
50 Minutes Total
Step 3: Read & Analyze the Application
Read the Application Mark as appropriate
Exercise: Step 3 Read and Analyze the Application
Activity Time (min) 1. Select a scribe, timekeeper and reporter (1) 2. Review individually your assigned Criteria Item 15 3. Discuss at your table as a group your observations on the applicant’s response against the Criteria questions. Table 1/6/14: 7.1; Table 2/7: 7.2; Table 3/8: 7.3; Table 4/9: 7.4; Table 5/10: 7.5; Table 6/11: 7.3; Table 7/12: 7.4; Table 8/13: 7.5 20 4. Report Out (1 minute per table?) 5
40 Minutes Total
What did we learn now?
Step 4: Identify Strengths/OFIs
Around 6 comments Strengths and OFIs
Exercise: Step 4 Identify Strengths/OFIs
Activity Time (min) 1. Select a scribe, timekeeper and reporter (1) 2. Select potential S/OFIs individually. Then, use a round robin approach to discuss individual S/OFIs identified 15 3. From this list, discuss at your table and select as a group, a total of around 4/6 potential S/OFIs. Then select 2 S/OFIs that you feel are most important. Table 1/6/14: 7.1; Table 2/7: 7.2; Table 3/8: 7.3; Table 4/9: 7.4; Table 5/10: 7.5; Table 6/11: 7.3; Table 7/12: 7.4; Table 8/13: 7.5
20 5 5. Report Out (1 minute per table) 10
50 Minutes Total
Step 5: Write Feedback Ready Comments
Remember: NERD!
N – nugget of
importance
E – evidence/example
to support comments
R – relevance to the
applicant
D – Done!
Exercise: Step 5 Write Feedback Ready Comments
Activity Time (min) 1. Select a scribe, timekeeper and reporter (1) 2. Draft feedback ready S/OFI comments (split table into 2 groups; 1 S and 1 OFI) Table 1/6/14: 7.1; Table 2/7: 7.2; Table 3/8: 7.3; Table 4/9: 7.4; Table 5/10: 7.5; Table 6/11: 7.3; Table 7/12: 7.4; Table 8/13: 7.5 3. Give feedback to the other group and then redraft the comment, using their input 4. Record the final feedback ready comment on chart paper 15 10 10
10
45 Minutes Total
Step 6: Determine the Scoring Range and Score
Best Fit Don’t Block a Winner Tie goes to applicant
Exercise: Step 6 Scoring
Activity Time (min) 1. Select a scribe, timekeeper and reporter (1) 2. Using your S/OFI comments from Step 4 and the Scoring Guidelines, discuss as a group the most appropriate scoring range for your assigned Item. Table 1/6/14: 7.1; Table 2/7: 7.2; Table 3/8: 7.3; Table 4/9: 7.4; Table 5/10: 7.5; Table 6/11: 7.3; Table 7/12: 7.4; Table 8/13: 7.5 15 3. Next, discuss the appropriate score within that range 4. Record the scoring range and score on chart paper and be prepared to discuss why you chose that score 15 10 5. Report Out (1 minute per table) 5
45 Minutes Total
Learnings?
Scorebook Navigator
Links to the IR and consensus manuals for Scorebook Navigator are on the Quality Texas Scorebook Navigator Page
Quality Texas Foundation
Scorebook Navigator Examiner Training
Scorebook Sign On
Scorebook Sign On
TX (Capital First Name, First Letter, Capital Last Name First Letter then the Remainder of Last Name) Example – TXKSimpson (unless you have a very common name and then your full name is spelled out)
Initial – Same as Logon +1 (TXKSimpson1) Change Password – Go to My Account (Far Right on Navigation Bar)
Changing Your Password
129
Scorebook Screen
Scorebook Screen
Stage 1 Scorebook
Scorebook Navigation Bar
Sign Out Scorebooks Key Factors Item Evaluation Key Themes Reports My Account
Icons
Spell Checker Find and Replace Text Print Preview Display the Criteria Display the Application Record Action Items Team Members Save Expanded Text Entry Area Delete Current Row Move Current Row Up Move Current row Down Key Factors
Key Factors
Item Evaluation
This is the top portion of the evaluation section
Evaluation
continues as you scroll down the page.
Key Factor Reference
After you click the Save icon, the key factor Organizational Profile Area to Address number that corresponds with your Key Factor selection appears here. Pick the appropriate key factor from the drop-down menu that appears when you click on a field in this column.
Strengths & OFI’s
Item Scoring Panel
Stage 2 Scorebook
Last Things!
things!
Consensus Review
Improve scoring and feedback by combining Independent Reviews into team-level Consensus Review
team to consensus in SN
move into 1 CR scorebook
team revised and refined
What Does “Consensus” Mean?
Consensus is:
– A rationally-derived decision – Based on the contributions
members – Supported by ALL team members
Composition of Consensus Teams
(1 TL, 2 BUTLs, 1 FB Editor, 4/6 Examiners)
(1 TL, 2 BUTLs, 1 FB Editor, 6/8 Examiners)
TL, 2 BUTLs, 1 FB Editor, 6/8 Examiners)
Composition of Consensus Team
(for Site Visit Award Level)
– 1 TL, – 3 BUTLs, – 2 FB Editors, – 4-6 Examiners)
Consensus Goals
S/OFIs that assists your applicant to move to the next level of performance excellence.
scorebook based on the Criteria and Organization’s Application.
negative terms like “ding them”, “got them” in our approach on this. NEVER!
Prepare for Consensus
This stage begins with some introductory work:
timelines
team leader
Consensus Review manual on the QTF website
The Consensus Planning Call
Calendar Schedule
SCOREBOOK NAVIGATOR
Consensus Role: Category Lead or Back-up
Category Lead
– Complete synthesis of IR Comments – Share consensus comments with back-up/receive input – Revise comments based on back- up input; post your items – Prepare for consensus call by developing category script
– Lead your item discussions (from your script)
– Revise consensus comments – Post final comments
Back-up Category Lead
– Review consensus comments provided by Category Lead – Provide input on comments to Category Lead
– Take notes for the Category Lead to capture comments and recommended changes – Help the Category Lead stay on time
– Share notes with Category Lead on suggested changes
feedback-ready comments) for each Item assigned to you
maturity
including outliers
for the consensus call
As Category Lead, You Will…
Category Back-Up
each comment in the Notes section in Scorebook Navigator
Scorebook Navigator
As a Team Member, You Will…
Conduct Consensus Meeting
OFIs are changed, edited or decisions change
and scores for each Item and Key Themes
Reaching Consensus
be heard
support the team decision
imply 100% agreement
Consensus Review Scorebook
This CR Scorebook is comprised
represents the collective knowledge and analytical skills of a team of examiners by using a systematic review process. This CR Scorebook Serves as the basis for the feedback report.
Consensus Follow-Up
Non-Site-Visit Applications
assigned items based on consensus discussion and
Feedback Report Template Site Visit Applications
assigned items based on consensus discussion and
Consensus: Success Factors
commitments
to them
Consensus Process Deliverables
Site Visit, A, P
– Clear and complete – Criteria-centered – No conflicting comments
– Reflect applicant maturity
Non-Site Visit, E, C, P
– Clear and complete – Criteria-centered – Contain actionable feedback – No conflicting comments
– Reflect applicant maturity
Consensus Call: Key Themes
throughout application i.e. strategic planning, action plans, workforce issues, etc.
based on application review and consensus
Scorebook Navigator and includes as part of team consensus report
Exercise: Consensus Process
Activity Time (min) 1. Select a scribe, timekeeper and reporter (1) 2. Walk through the consensus process at your table, using insight from the returning examiners. 20 3. Document the top three learnings about the consensus process from your table discussion
5. Report Out (2-3 tables) 5
25 Minutes Total
Key Themes
Applicant Executive Overview
What’s a Key Theme?
identified in the Organizational Profile and elsewhere in the application)
cutting”)
Key Themes Must…
Criteria core values
will have more key theme strengths than OFIs and vice versa.
assessment in Scorebook Navigator; will sometimes be easier to see after completion of all 7 Categories
Key Themes Respond to These Questions:
a) What are the most important strengths or outstanding practices (of potential value to other organizations) identified? b) What are the most significant opportunities, concerns,
c) Considering the applicant’s key factors, what are the most significant strengths (data, comparisons, and linkages) found in its results? d) Considering the applicant’s key factors, what are the most significant opportunities, vulnerabilities, and/or gaps (data, comparisons, and linkages) found in its results?
A Key Theme Process Strength
Senior leaders’ focus on the applicant’s vision, mission, and values (VMV) promotes its core health care business, contributing to organizational, financial, and societal performance. The VMV create the applicant’s culture and permeate strategic planning and daily operations. Identification of key communities and their needs embeds societal responsibilities into the applicant’s strategies, strategy implementation, action plans, and daily
the option of English or Spanish messaging for individuals without computer access, the provision of transportation and child care, and health education outreach. To meet the vision of a healthy population, the applicant organizes its workforce into Primary Care Teams, creates personalized health plans, and sets goals for
volunteers and members from the communities the applicant
patient-centered care and expertise in treating diseases prevalent in its population.
A Key Theme Process OFI
There are gaps in the applicant’s approaches to providing the range of treatment services aligned to its mission and to its core competency of expertise in treating diseases prevalent in its patient population (e.g., mental health issues, alcohol and substance abuse, obesity, diabetes, and heart disease). For example, alignment between the processes and requirements in Figure 6.1-1 and health care offerings that meet identified community needs is not evident, and some FOCUS measures do not clearly align with
will address major health challenges. Leveraging the applicant’s core competency of expert treatment, as well as its core competency of collaborative relationships, to align services provided and measures tracked with its stated objectives may help the applicant move toward its vision of a healthier population.
A Key Theme Results Strength
AF’s results for screening and access to care, as well as customer-focused and some financial results, contribute to fulfilling the mission of providing residents easy and timely access to high-quality and safe health care services. In particular, the applicant reports good levels, beneficial trends, and favorable comparisons for screening
results exceeding the state average for community health centers (CHCs). In addition, aggregate patient satisfaction and satisfaction with medical and dental services meet or exceed the top-decile comparisons. Collectively, these results underscore the applicant’s core competencies of patient-centered care and expertise in treating diseases prevalent in its population.
A Key Theme Results OFI
The applicant does not provide some important business and financial results. Examples are missing or limited results for operating margin, fundraising revenues, cost control, and ACA impact; results for action plan outcomes; and results for the success of patient acquisition and retention mechanisms. In addition, the applicant does not report comparisons to local or regional competitors for many patient and other customer satisfaction results
to the applicant’s strategic challenge of staff
ensuring financial and organizational sustainability in a rapidly changing health care environment.
Site Visits
Be prepared, be prepared, be prepared!
Site Visit and Preparation
Team of Examiners
Calls
Issues
Site Visit Scorebook is Complete (last step of process)
Actual Site Visit
discussed)
site visit issue resolution
feedback report)
examiner reimbursed
Next Steps
Assignment of Examiner Teams
Recommendations
Westin Memorial City, Houston, Texas; Examiner Appreciation Event
After-Action Review
begin/continue the assessment stages?
Last Things…Almost!
forms!
WORK!
176