
SLIDE 1
2013 Half Year Results
31 July 2013
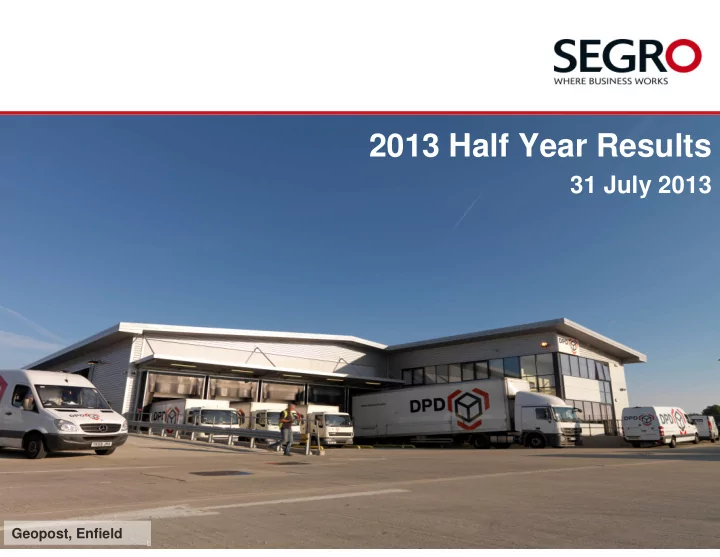
Geopost, Enfield
2013 Half Year Results 31 July 2013 Geopost, Enfield An active and - - PowerPoint PPT Presentation
2013 Half Year Results 31 July 2013 Geopost, Enfield An active and successful period Strong operational performance Lettings up 30% Good momentum in development pipeline Further cost savings achieved Portfolio valuation up
Geopost, Enfield
1
Booker, Hatfield
3
4
H1 2013 £m H1 2012 £m Gross rental income 144.6 156.9 Property operating expenses (25.9) (26.0) Net rental income 118.7 130.9 Joint venture management fee income 2.0 2.9 Share of joint ventures’ EPRA profit1 11.4 10.1 Administration expenses (12.1) (13.1) EPRA operating profit 120.0 130.8 EPRA net finance costs (51.0) (55.9) EPRA profit before tax 69.0 74.9 Tax on EPRA profit (0.9) (1.3)
1 Net property rental income less administrative expenses, net interest expenses and taxation
£130.9m £118.7m
£2.1m £6.2m £7.0m £(19.5)m £(7.1)m £(0.6)m £(0.3)m
H1 2012 Currency translation Developments Acquisitions Disposals Neckermann impact Like for like net rental income Surrender premiums &
H1 2013
5
H1 2012 H1 2013
30.4% 29.9% 28.1% 24.5% 22.9% 23.5% 15 20 25 30 35 FY 2008 FY 2009 FY 2010 FY 2011 FY 2012 H1 2013
6 1 Total costs as a percentage of gross rental income. Total costs include vacant property costs
H1 2013 £m H1 2012 £m Change % Gross rental income (inc. share of JVs) 165.3 176.5 (6.3) Property operating expenses (25.9) (26.0) (0.4) Administrative expenses (12.1) (13.1) (7.6) Net JV costs (0.8) (0.6) 33.3 Total costs (38.8) (39.7) (2.3) EPRA total cost ratio1 (%) (including vacant property costs)
22.4%
Excluding Neckermann
294p 294p
9.2p 1.8p (9.9)p (1.1)p EPRA EPS FX movements Dividend Realised and unrealised valuation movements
7
EPRA NAV per share as at 31 December 2012 EPRA NAV per share as at 30 June 2013
8
30 June 2013 30 June 2013 Pro forma1 31 Dec 2012 Group: Net borrowings (£m) 2,132 1,313 2,090 Available funds - cash & undrawn facilities (£m) 325 1,011 449 Gearing (%) 96 65 93 Weighted average cost of debt2, 5 (%) 4.5 5.2 4.6 Average duration of debt (years) 7.8 9.2 8.3 Interest cover3 (x) 2.3 2.0 2.3 Including JVs at share: Net borrowings4 (£m) 2,436 1,784 2,388 LTV ratio - including JVs at share4 (%) 52 44 51 Weighted average cost of debt2, 5 (%) 4.4 4.8 4.5
1 Pro forma for disposals completed after the period end and the SELP transaction 2 Excluding commitment fees and amortised costs 3 Net rental income / EPRA net finance costs (before capitalisation) 4 Includes deferred consideration from the SELP transaction 5 Based on gross debt
52% 44%
(3)% (4)% (1)% IQ Winnersh SELP Neckermann
9
LTV ratio at 30 June 2013 Pro forma LTV ratio at 30 June 2013
1 Based on average and closing exchange rate for H1 2013 of €1.17 / £1 2 Includes £129m of deferred consideration from PSP and £4m gain on sale from 7% coupon on deferred consideration. Net of SEGRO equity contribution to SELP and £3m of transaction costs incurred to date 3 50% of value of properties sold 4 Excludes £30m to acquire Belgian JV assets and capex 5 Gross proceeds before rent guarantees, top ups and transaction costs
Gross proceeds1, 5 (£m) 245 5712 39 Book value1 (£m) 228 4163, 4 39 Share of JV bank debt1 (£m) n/a 166 n/a
10
EPRA PBIT £m
Reported H1 2013 operating profit 120.0 Pro forma impact of significant H1 2013 transactions Disposals in H1 (1.1) Acquisitions in H1 0.8 Developments completed and let in H1 1.0 Net impact of Neckermann departure 0.9 121.6 Pro forma impact of significant H2 2013 transactions
As occurring At 1 July
IQ Winnersh sale (6.0) (7.2) SELP transaction (7.4) (14.7) Neckermann sale (0.2)
0.6 1.2 Pro forma H2 operating profit 108.6 100.9 Plus impact of 2014 development completions and further capital recycling activity
11
Selig, Slough Trading Estate
13
14
15
+0.8%
0.0%
(2.4)%
+0.3%
(0.4)%
0.0%
0.0% 0.5% 1.0% 1.5% 2.0% 2.5% Logistics Light industrial & urban distribution Data centres Other business space
H1 2013 Core warehouse portfolio by asset type
Valuation including joint ventures at share (including land and development) and in relation to the completed properties only
0.0% 1.0% 2.0% 3.0% 4.0% Heathrow Park Royal STE LPP Rest of Greater London Germany France Poland
H1 2013 Core warehouse portfolio by geography
16
Thales, UK (£80m) IQ Winnersh, UK (£245m) MPM, Munich (£56m) Neckermann, Germany (£39m)
17
1 Including our share of joint venture assets 2 Income based on headline rental income (after the expiry of rent free periods) 3 Excluding Neckermann (contracts exchanged to sell after the period end)
At 30 June 20131 Valuation £m Income2 £m ‘Big 2’ assets3 157 16 Other assets & land 403 36 Total 560 52
29% 71% Geographical split UK Continental Europe Pegasus Park, Brussels Energy Park, Milan
18
Continental Europe logistics platform
Continental European logistics portfolio, including 84 hectares of development land
accelerate growth and take advantage of consolidation opportunities in Continental Europe
platform, generates management and development fees, improves risk adjusted returns
use of third party capital
Built Assets Location Land Holdings Location
19
Large logistics warehouse, UK
Urban distribution park, Warsaw
acquisition in Warsaw last year (Ozarow)
20
8 Completed development projects
14 Current development projects
1 2 3 4 5 6
1. DPD, Wroclaw 2. Speculative development, Krefeld, near Dusseldorf 3. Warmup, Tudor Estate at Park Royal
5. FedEx, Slough Trading Estate 6. Toll Global Forwarding, North Feltham
£25m invested in land for future development
Geopost, Enfield
Limited supply of modern warehouse assets
UK supply (millions sq ft)
5 10 15 20 25 30 H2 2006 H2 2007 H2 2008 H2 2009 H2 2010 H2 2011 H2 2012 H1 2013 5 10 15 20 25 30 35 40 2012 2020
Attractive structural demand drivers Growth in internet retailing, convenience shopping and B2B distribution requiring local delivery/fulfilment solutions On-going supply chain improvements by retailers, manufacturers & third party logistics providers Increasing need for electronic data storage solutions driving demand for data centres Recovery in high-tech/engineering-led production
22
Source: Capital Science Corporation, 2013
0.5 1 1.5 2 2.5 2012 2017
Source: IMRG, 2013
Global data volume increase (zetabytes) UK e-commerce related parcel volume increase (billions of items) 10 20 30 40 50 60 2012 2017 UK online retail sales (£ billion)
Source: Forrester, European online retail forecast 2013 Source: JLL
23
24
5,700 sq m at Park Royal 5,200 sq m in Lyon, France 11,700 sq m in Krefeld, Dusseldorf 2,600 sq m at The Heathrow Estate 4,300 sq m at Slough Trading Estate 3,100 sq m pre-let signed Slough Trading Estate 6,900 sq m pre-let completed Wroclaw Existing space New developments
25
Potential development projects
Residual land bank £86m (231 ha) Current projects £49m (31 ha) Potential development projects £200m (310 ha)
Current land holdings by value
(as at 30 June 2013)
1 Total development cost (including land)
26
29
Month Portfolio/Asset Acquirer Sale proceeds (£m) Net initial yield (%) H1 2013: January Thales in Crawley L&G Property 80.0 5.9 / 5.91 February MPM in Munich Private investor 55.6 7.9 / 7.91 Various Other non-core assets Various 16.6 7.7 / 7.71 H2 2013: July IQ Winnersh Patrizia AG & Oaktree Capital LP 245.1 5.9 / 7.41 July Neckermann site Private investors 39.3 n/a Sub total 436.62 6.2 / 7.21 2012 548.1 7.3 / 7.91 Total 984.7 6.8 / 7.61
1 Including the benefit of top-ups 2 Excluding the sale of assets into SELP
30
Project Customer Space to be built (sq m) UK Pre-let projects under construction Feltham (joint venture) Toll / spec 8,000 Edmonton, London Premier Inn 4,000 Contracted projects Slough Trading Estate Fedex / spec 6,000 Speculative developments Edmonton Spec 7,800 Slough Trading Estate Spec 3,300 Total 25,100* Project Customer Space to be built (sq m) CONTINENTAL EUROPE Pre-let projects under construction Vimercate, Italy Alcatel-Lucent 34,000 Nardarzyn – Warsaw, Poland Zabka 23,800 Alzenau, Frankfurt Sauerbrei / spec 17,300 Komorniki II, Poland Good Food / Colquimica / spec 9,200 Wroclaw, Poland Specjal / spec 6,600 Hostivice, Czech Republic IKEA 5,700 Tychy, Poland Zabka extension 2,500 Contracted projects Ozarow, Poland CAT 4,600 Speculative developments Berlin, Germany Spec 8,500 Total 112,200
* Includes Feltham project at Group share
32
H1 2013 H1 2012 Group £m JVs £m Total £m Group £m JVs £m Total £m Gross rental income 144.6 20.7 165.3 156.9 19.6 176.5 Property operating expenses (25.9) (1.4) (27.3) (26.0) (1.0) (27.0) Net rental income 118.7 19.3 138.0 130.9 18.6 149.5 Joint venture management fee income 2.0 (1.4) 0.6 2.9 (1.6) 1.3 Administration expenses (12.1)
(13.1) (0.1) (13.2) EPRA operating profit 108.6 17.9 126.5 120.7 16.9 137.6 EPRA net finance costs (51.0) (6.6) (57.6) (55.9) (6.8) (62.7) EPRA profit before tax 57.6 11.3 68.9 64.8 10.1 74.9 Tax on EPRA profit (0.9) 0.1 (0.8) (1.3)
EPRA profit after tax 56.7 11.4 68.1 63.5 10.1 73.6
33
H1 2013 £m H1 2012 £m Opening net debt (2,090.3) (2,303.4) Cash flow from operations 91.4 107.4 Finance costs (net) (58.4) (52.3) Dividends received (net) 11.8 2.3 Tax paid (net) (0.7) (12.2) Free cash flow 44.1 45.2 Dividends paid1 (63.0) (65.9) Acquisitions and development of investment properties (93.6) (64.6) Investment property sales (including joint ventures) 155.7 352.5 Net settlement of foreign exchange derivatives (64.4) 45.8 Net investment in joint ventures (4.6) (50.8) Other items 0.2 2.7 Net funds flow (25.6) 264.9 Non-cash movements (2.1) (2.3) Exchange rate movements (14.3) 18.5 Closing net debt (2,132.3) (2,022.3)
1 Payment of the final dividend (9.9p), not interim dividend (4.9p), in both years
£74.9m £69.0m
£4.9m £1.3m £1.0m £(0.9)m £(12.2)m H1 2012 Net interest EPRA JV PAT Admin expenses JV management fees Net rental income H1 2013
34
9.5% 8.9%
0.1% 0.5% (1.2)% IQ Winnersh SELP Neckermann
35
Vacancy at 30 June 2013 Pro forma vacancy at 30 June 2013
2,016 424 1,195 122
Balance sheet (as at 30 June 2013) Euro gross assets Euro debt Euro currency swaps Other Euro liabilities € million
+ 5% (€1.23) = - c.£11m (c1.5p per share)
55 36
Income statement (six months to 30 June 2013) Euro income Euro costs (incl €30m interest) € million
+ 5% (€1.23) LTV - 0.5%
1,741
+ 5% (€1.23) = - c.£1.8m (c0.2p per share)
1 Including JVs at share
£0m £100m £200m £300m £400m £500m £600m 2013 2014 2015 2016 2017 2018 2019 2020 2021 2022 2023 2024+ Bonds and Notes Bank debt drawn Cash Undrawn Facilities
37
Average maturity of gross borrowings 7.8 years (31 December 2012: 8.3 years)
39
up to 2 years(1)
average margin above Euribor of c. 185bps (credit committee approved and subject to finalisation of due diligence and documentation)
Notes
Capitalisation
seed land
Commitment for Growth
the Target Markets Exclusivity
Liquidity
Fees
40
Proceeds to SEGRO(1) £m June-13 Pro Forma
Look-through Net Debt 2,436 2,061 Look-through GAV 4,687 4,301 Look-through LTV (%)(4) 52% 48% EPRA NAV (pp) 294 292
Balance Sheet Impact(1)
(€508 million) with a further £129 million (€152 million) of consideration deferred for up to two years
depending on Group’s funding requirements
any balance held in cash
‒ Reduction in Group net debt of £571 million(1)(3) ‒ Look-through LTV as at 30 June 2013 reducing on a pro forma basis by 4% from 52% to 48% ‒ Pro forma EPRA NAV decreased from 294 pp to 292 pp including net costs of £17m in respect of transaction costs and transfer taxes / stamp duties ‒ No anticipated change in rating from Fitch
€m £m
Sale of Seed Portfolio 973.8 831.6 Less: SEGRO equity contribution (50%)(2) (303.2) (258.9) Less: SEGRO transaction costs (10.6) (9.1) Total Proceeds 660.0 563.6
508.4 434.2
(up to 2 years) 151.6 129.4
Notes
41
million (€13 million), as a result of: ‒ The deleveraging effect from selling 50% of the assets going into the Venture (loss of rents less interest savings) ‒ Partially compensated by fees earned from the Venture and the interest income on the deferred consideration
as proceeds are re-invested into the Venture and in its
‒ Remain committed to at least maintain the dividend through the portfolio re-shaping process
£m pp NRI Impact (54.2) (7.4) Reduction of JV earnings (Belgium JV)(2) (1.0) (0.1) Share of Venture earnings 20.5 2.8 Fees from Venture 5.2 0.7 Interest Savings(3) 12.2 1.6 Coupon on Deferred Consideration(4) 6.5 0.9 Total impact on SEGRO earnings (10.8) (1.5) Annualised Impact on EPRA Post-Tax Earnings(1) Impact of Re-Investment into the JV on EPRA Earnings (£m)(1)(5)
Total Portfolio Investment by SEGRO (50% Share)
€200m €350m €500m Average Gross Yield 7.0% £7.2m £12.6m £18.0m 7.5% £8.0m £14.0m £20.0m 8.0% £8.8m £15.4m £22.0m
Notes
at an all-in interest rate of c.3%; assumes 5% transaction costs, and Venture / property management fees (excluding any development management fees)
42
This presentation may contain certain forward-looking statements with respect to SEGRO’s expectations and plans, strategy, management’s
future performance, costs, revenues and other trend information. These statements and forecasts involve risk and uncertainty because they relate to events and depend upon circumstances that may occur in the future. There are a number of factors which could cause actual results or developments to differ materially from those expressed or implied by these forward looking statements and forecasts. The statements have been made with reference to forecast price changes, economic conditions and the current regulatory environment. Nothing in this presentation should be construed as a profit forecast. Past share performance cannot be relied on as a guide to future performance.