2013 Federal vs. Private Autism Research Funding Private 23.62% - - PowerPoint PPT Presentation

2013 federal vs private autism research funding
SMART_READER_LITE
LIVE PREVIEW

2013 Federal vs. Private Autism Research Funding Private 23.62% - - PowerPoint PPT Presentation

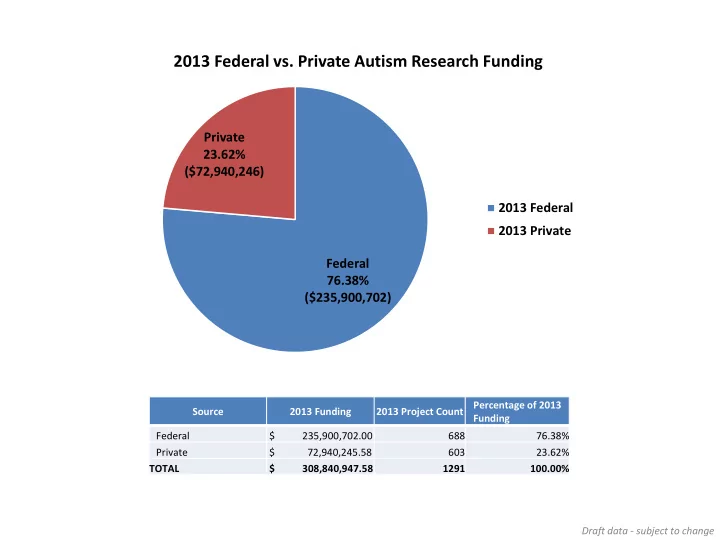
2013 Federal vs. Private Autism Research Funding Private 23.62% ($72,940,246) 2013 Federal 2013 Private Federal 76.38% ($235,900,702) Percentage of 2013 Source 2013 Funding 2013 Project Count Funding Federal $ 235,900,702.00


slide-1
SLIDE 1

Source 2013 Funding 2013 Project Count Percentage of 2013 Funding Federal $ 235,900,702.00 688 76.38% Private $ 72,940,245.58 603 23.62% TOTAL $ 308,840,947.58 1291 100.00% Draft data - subject to change

Federal 76.38% ($235,900,702) Private 23.62% ($72,940,246)

2013 Federal vs. Private Autism Research Funding

2013 Federal 2013 Private

slide-2
SLIDE 2

Federal or Private Funder 2013 Funding Percentage

  • f 2013

Funding

Administration for Children and Families (ACF) $ - 0.00% Agency for Healthcare Research and Quality (AHRQ) $ 1,233,747.00 0.40% Autism Research Institute (ARI) $ 210,669.00 0.07% Autism Speaks (AS) $ 18,632,126.56 6.03% Autism Science Foundation (ASF) $ 389,000.00 0.13% Brain and Behavior Research Foundation (BBRF) $ 562,985.95 0.18% Center for Autism and Related Disorders (CARD) $ 602,300.00 0.20% Centers for Disease Control and Prevention (CDC) $ 19,337,864.00 6.26% Centers for Medicare and Medicaid Services (CMS) $ 13,495.00 0.00% Department of Defense – Air Force (DoD AF) $ 966,000.00 0.31% Department of Defense – Army (DoD Army) $ 4,514,151.00 1.46% Department of Education (ED) $ 22,716,258.00 7.36% Environmental Protection Agency (EPA) $ 1,660,178.00 0.54% Health Resources and Services Administration (HRSA) $ 7,201,186.00 2.33% National Institutes of Health (NIH) $ 175,908,374.00 56.96% National Science Foundation (NSF) $ 2,349,449.00 0.76% Organization for Autism Research (OAR) $ 340,235.26 0.11% Patient-Centered Outcomes Research Institute (PCORI) $ 1,757,884.04 0.57% Simons Foundation (SF) $ 50,445,044.77 16.33% TOTAL $ 308,840,947.58 100.00%

Percentage of 2013 Funding by Agency/Organization

Draft data - subject to change

AHRQ 0.40% ($1,233,747) ARI 0.07% ($210,669) AS 6.03% ($18,632,127) ASF 0.13% ($389,000) BBRF 0.18% ($562,986) CARD 0.20% ($602,300) CDC 6.26% ($19,337,864) CMS 0.00% ($13,495) DoD AF 0.31% ($966,000) DoD Army 1.46% ($4,514,151) ED 7.36% ($22,716,258) EPA 0.54% ($1,660,178) HRSA 2.33% ($7,201,186) NIH 56.96% ($175,908,374) NSF 0.76% ($2,349,449) OAR 0.11% ($340,235) PCORI 0.57% ($1,757,884) SF 16.33% ($50,445,045)

slide-3
SLIDE 3

Strategic Plan Question 2013 Funding Percentage of 2013 Funding 2013 Project Count Percentage of 2013 Project Count Question 1: Diagnosis $ 27,652,658.19 8.95% 128 9.91% Question 2: Biology $ 96,872,439.13 31.37% 477 36.95% Question 3: Risk Factors $ 55,666,350.95 18.02% 147 11.39% Question 4: Treatments $ 58,065,840.36 18.80% 268 20.76% Question 5: Services $ 20,026,744.18 6.48% 126 9.76% Question 6: Lifespan $ 3,152,885.02 1.02% 28 2.17% Question 7: Infrastructure $ 47,404,029.75 15.35% 117 9.06% TOTAL $ 308,840,947.58 100.00% 1291 100.00% Draft data - subject to change

Q1 8.95% ($27,652,658) Q2 31.37% ($96,872,439) Q3 18.02% ($55,666,351) Q4 18.80% ($58,065,840) Q5 6.48% ($20,026,744) Q6 1.02% ($3,152,885) Q7 15.35% ($47,404,030)

Percentage of 2013 Funding

Question_1_Diagnosis Question_2_Biology Question_3_Risk_Factors Question_4_Treatments Question_5_Services Question_6_Lifespan Question_7_Infrastructure

Q1 9.91% (128) Q2 36.95% (477) Q3 11.39% (147) Q4 20.76% (268) Q5 9.76% (126) Q6 2.17% (28) Q7 9.06% (117)

Percentage of 2013 Project Count

Question_1_Diagnosis Question_2_Biology Question_3_Risk_Factors Question_4_Treatments Question_5_Services Question_6_Lifespan Question_7_Infrastructure

slide-4
SLIDE 4

75.87% ($234,325,837) 24.13% ($74,515,110)

2013 Funding: Alignment with IACC Strategic Plan Objectives

Specific to Question Objectives Core/Other

2013 Funding Percentage of 2013 Funding Specific to Question Objectives $ 234,325,837.18 75.87% Core/Other $ 74,515,110.40 24.13% TOTAL $ 308,840,947.58 100.00% Draft data - subject to change

slide-5
SLIDE 5

2013 Funding: Alignment with IACC Strategic Plan Objectives by Question

Q1. Diagnosis Q2. Biology Q3. Risk Factors Q4. Treatments Q5. Services Q6. Lifespan Issues Q7. Infrastructure

Specific to Question Objectives $ 27,262,721.19 $ 51,072,288.33 $ 55,128,524.95 $ 52,351,118.36 $ 12,776,635.18 $ 2,062,646.42 $ 33,671,902.75 Core/Other $ 389,937.00 $ 45,800,150.80 $ 537,826.00 $ 5,714,722.00 $ 7,250,109.00 $ 1,090,238.60 $ 13,732,127.00 Core/Other (%) 1.41% 47.28% 0.97% 9.84% 36.20% 34.58% 28.97%

Draft data - subject to change

$- $20,000,000 $40,000,000 $60,000,000 $80,000,000 $100,000,000

  • Q7. Infrastructure
  • Q6. Lifespan Issues
  • Q5. Services
  • Q4. Treatments
  • Q3. Risk Factors
  • Q2. Biology
  • Q1. Diagnosis

Specific to Question Objectives Core/Other

slide-6
SLIDE 6

Question 2: Biology

2013 Funding* 2013 Project Count Percentage of 2013 Question Funding Question_2_Biology $ 96,872,439.13 477 100.00%

  • 2SA. Support at least four research projects to identify mechanisms of fever, metabolic and/or immune system interactions with the central nervous system

that may influence ASD during prenatal-postnatal life by 2010. IACC Recommended Budget: $9,800,000 over 4 years. (Fever studies to be started by 2012.) $ 2,801,876.01 29 2.89%

  • 2SB. Launch three studies that specifically focus on the neurodevelopment of females with ASD, spanning basic to clinical research on sex differences by
  • 2011. IACC Recommended Budget: $8,900,000 over 5 years.

$ 2,859,333.00 7 2.95%

  • 2SC. Identify ways to increase awareness among the autism spectrum community of the potential value of brain and tissue donation to further basic

research by 2011. IACC Recommended Budget: $1,400,000 over 2 years. $ 674,525.00 3 0.70%

  • 2SD. Launch three studies that target improved understanding of the underlying biological pathways of genetic conditions related to autism (e.g. Fragile X,

Rett syndrome, tuberous sclerosis complex) and how these conditions inform risk assessment and individualized intervention by 2012. IACC Recommended Budget: $9,000,000 over 5 years. $ 18,627,373.40 95 19.23%

  • 2SE. Launch three studies that target the underlying biological mechanisms of co-occurring conditions with autism, including seizures/epilepsy, sleep

disorders, wandering/elopement behavior, and familial autoimmune disorders, by 2012. IACC Recommended Budget: $9,000,000 over 5 years. $ 4,848,554.54 23 5.01%

  • 2SF. Launch two studies that focus on prospective characterization of children with reported regression to investigate potential risk factors by 2012. IACC

Recommended Budget: $4,500,000 over 5 years. $ 316,475.50 3 0.33%

  • 2SG. Support five studies that associate specific genotypes with functional or structural phenotypes, including behavioral and medical phenotypes (e.g.,

nonverbal individuals with ASD and those with cognitive impairments) by 2015. IACC Recommended Budget: $22,600,000 over 5 years. $ 12,646,192.08 49 13.05%

  • 2LA. Complete a large-scale, multi-disciplinary, collaborative project that longitudinally and comprehensively examines how the biological, clinical, and

developmental profiles of individuals, with a special emphasis on females, youths, and adults with ASD, change over time as compared to typically developing people by 2020. IACC Recommended Budget: $126,200,000 over 12 years. $ 5,201,378.00 7 5.37%

  • 2LB. Launch at least three studies which evaluate the applicability of ASD phenotype and/or biological signature findings for performing diagnosis, risk

assessment, or clinical intervention by 2015. IACC Recommended Budget: $7,200,000 over 5 years. $ 3,096,580.80 13 3.20%

  • 2O. Not specific to Question 2 objectives

$ 45,800,150.80 248 47.28% *Any objective colored green has funding which is greater than or equal to the recommended funding for the year (determined by annualizing the recommended budget associated with that objective); any

  • bjective colored yellow has active projects, but with funding that totals less than the annualized recommended amount, while any objective colored red has no active projects and received no funding in 2013.

Objectives whose overarching aim (e.g., the ultimate goal of the research) was achieved in a previous year are colored pale green.

Draft data - subject to change

slide-7
SLIDE 7

Question 2: Biology 2013 Funding Percentage of 2013 Funding 2013 Project Count Percentage of 2013 Project Count Cognitive studies $ 4,170,804.00 4.31% 23 4.82% Computational science $ 3,341,053.50 3.45% 18 3.77% Co-occurring conditions $ 5,069,825.04 5.23% 25 5.24% Developmental trajectory $ 8,825,802.80 9.11% 21 4.40% Immune/Metabolic pathways $ 2,960,232.01 3.06% 31 6.50% Molecular pathways $ 31,075,733.90 32.08% 171 35.85% Neural systems $ 17,418,734.00 17.98% 82 17.19% Neuropathology $ 2,627,476.50 2.71% 18 3.77% Sensory and motor function $ 4,900,701.00 5.06% 26 5.45% Subgroups/Biosignatures $ 16,482,076.38 17.01% 62 13.00% TOTAL $ 96,872,439.13 100.00% 477 100.00%

Cognitive studies 4.31% ($4,170,804) Computational science 3.45% ($3,341,054) Co-occurring conditions 5.23% ($5,069,825) Developmental trajectory 9.11% ($8,825,803) Immune/Metabolic pathways 3.06% ($2,960,232) Molecular pathways 32.08% $31,075,734 Neural systems 17.98% ($17,418,734) Neuropathology 2.71% ($2,627,477) Sensory and motor function 5.06% ($4,900,701) Subgroups/ Biosignatures 17.01% ($16,482,076) Cognitive studies 4.82% (23) Computational science 3.77% (18) Co-occurring conditions 5.24% (25) Developmental trajectory 4.40% (21) Immune/Metabolic pathways 6.50% (31) Molecular pathways 35.85% (171) Neural systems 17.19% (82) Neuropathology 3.77% (18) Sensory and motor function 5.45% (26) Subgroups/ Biosignatures 13.00% (62)

Question 2 – Percentage of 2013 Funding by Subcategory Question 2 – Percentage of 2013 Project Count by Subcategory

Draft data - subject to change