
SLIDE 1
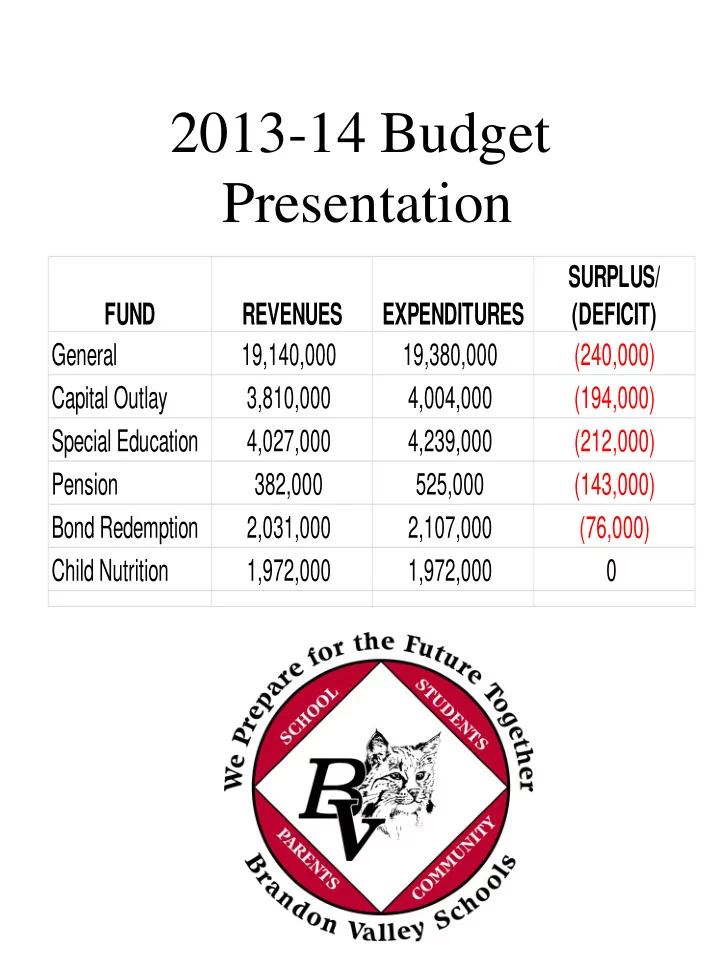
2013-14 Budget Presentation
FUND REVENUES EXPENDITURES SURPLUS/ (DEFICIT) General 19,140,000 19,380,000 (240,000) Capital Outlay 3,810,000 4,004,000 (194,000) Special Education 4,027,000 4,239,000 (212,000) Pension 382,000 525,000 (143,000) Bond Redemption 2,031,000 2,107,000 (76,000) Child Nutrition 1,972,000 1,972,000