1
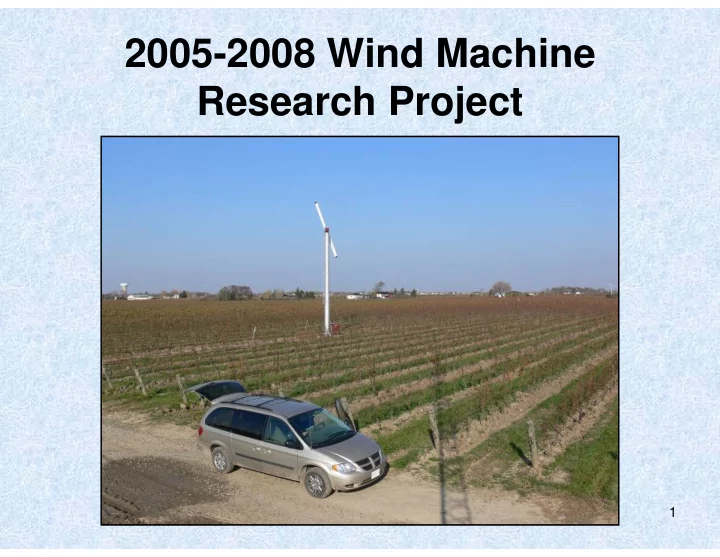
2005-2008 Wind Machine Research Project 1 Research Team Ontario - - PowerPoint PPT Presentation
2005-2008 Wind Machine Research Project 1 Research Team Ontario Ministry of Agriculture, Food & Rural Affairs Ken Slingerland , Tender Fruit and Grape Specialist Hugh Fraser , Agricultural Engineer Brock University Kevin Ker ,
2
Ontario Ministry of Agriculture, Food & Rural Affairs
– Ken Slingerland, Tender Fruit and Grape Specialist – Hugh Fraser, Agricultural Engineer
Brock University
– Kevin Ker, Research Associate
University of Guelph
– Dr. Helen Fisher, Department of Plant Agriculture
Research Team
3
- Co-sponsors
– Grape Growers of Ontario & Wine Council of Ontario
- Funders
– Grape Growers of Ontario – Wine Council of Ontario – CanAdvance (Agricultural Adaptation Council) – CRESTech (Ontario Centres of Excellence) – Orchard-Rite Wind Machines – Chinook Wind Machines – NPF&VGA – Ontario Tender Fruit Producers – Agricorp – KCMS
Thanks to our sponsors & funders
4
Broad objective of project
- Through applied field research, find the
- ptimum timing for using wind machines so
as to minimize their use, which is good for:
– Growers, as it saves them time and money, and – Neighbours, as it reduces nuisance noise effects
5
What are wind machines?
- Large fans that pull ‘warm’ air down from high
above ground during strong thermal inversions, raising air temperatures around cold-sensitive grapes & tender fruits
- They can help protect crops from cold-injury
affecting following crop & future plant health
- Now close to 500 in Ontario, mostly in grapes
6
Blades rotate, while also turning around the tower over a few minutes
Warm air above… …mixes with cold air at vine level
7
When are wind machines used?
- To protect crops against cold injury at 3 times:
– Winter’s cold temps (colder than about -15oC) – Late spring frosts – Early autumn frosts
8
Wind machine hours of use
- Research shows Niagara’s wind machines’
yearly use (winter/spring/fall) has been:
– Those operated 3 years: average 52 hours/year
- Wide range of 27 to 81 hours/year
– Those operated 2 years: average 43 hours/year
- Wide range of 29 to 75 hours/year
– Those operated 1 year: average 36 hours/year
- Wide range of 10 to 73 hours/year
9
Predicted hours of use
- We had predicted up to 75 to 100 h/year
- Now predict much less, but conservatively
– 25 to 75 h/year with long-term at 50 h/yr
- WM use goes down as….
– Experience goes up – Temperature/wind monitoring improves – Information on crop hardiness improves
- Wide range of use in same areas puzzling
10
Cold weather thermal inversions
- When air temp 2 ft above ground is < 0oC
and air temp 66 ft above ground is higher
– No inversions if winds > 8 km/h
- Greatest cold weather inversion yet 11.2oC
– Nov. 25, 2006 at 11:15 pm – -0.8oC at 2 feet, while balmy 10.4oC at 66 feet
11
Less use…less fuel cost
- Some growers using WM less based on
- ur findings about the lack of thermal
inversions when there is much wind
- If research means growers use WM just
10% less, or 5 h/yr, per machine, this is
- ver $100,000 savings in fuel costs for
industry & more sleep for neighbours (and growers…)
12
Recent cold weather
- Night of 15 Feb. ‘07 at research vineyards
– -22.1oC (Above Escarpment) at 7:15 am – -17.5oC (Virgil) at 7:15 am – Some growers reported colder temperatures – Be certain your temperature sensors are properly calibrated, and you are monitoring at appropriate locations
13
2006 spring frosts
- WM ran 4 nights in late
April/early May at our Virgil research vineyard
- Total of 29 hours
- Next 2 slides show how air
temperatures at 2 ft level were affected on 28 April 2006 just before WM turned
- n at 1:45 am, then at 2:45
am after 1 hour of operation
14
- Vineyard ‘floor’ at
base of graph shows temp sensor locations (feet on x & y-axis)
- Wind machine centre
- Bars ‘up’ are temps at
vines; -0.2oC to 0.4oC
- Dashed bar is temp
66 ft above ground, near 5oC, so about a 5oC ‘thermal inversion’
500 353 250 50
- 125
- 250
- 375
- 500
- 265
250 50
- 0.5
0.0 0.5 1.0 1.5 2.0 2.5 3.0 3.5 4.0 4.5 5.0
1:45 am, wind machine idling
15
- Note air temps in
influence of WM have risen 1.2 to 3.7oC (2.5oC ave); higher near WM
- Air temp 66 ft
above ground remains about the same, near 5oC
- Influence area is
being studied
500 353 250 50
- 125
- 250
375
- 500
- 265
250 5 0.0 0.5 1.0 1.5 2.0 2.5 3.0 3.5 4.0 4.5 5.0
2:45 am, wind machine full on
16
Wind Machine Sound Level Study
- Most sound from blades
– speed, diameter, shape, # blades, tower design, airflow, any wind present even from adjacent WM
- Sound worse in homes with
– Large rooms/equal dimensions – Squarish shape & corners – Large windows – Hard surfaces – Light construction, less insulation
17
Sound is cyclical for receivers
Generalized Sound Pressure Levels (dBA) vs. Time for One Cycle of a Wind Machine With Respect to Receiver
Time (4.5 to 6.5 minutes, depends on machine) dBA
8-11 dBA variance Airflow at receiver 3-5 dBA variance Airflow 90° to receiver Airflow away from receiver
Rotation around vineyard Blades Tower Airflow direction
Airflow 90° to receiver
18
Please consider your neighbours
- More WM are coming so keep these in mind
– Give closest neighbours heads up on new ones – Tell why needed & who to call if issues – Try to place WM so homes out of airflow range – Adjust temp sensors over winter season – Never operate WM at wind speeds above 8 km/h
19
Bud Sampling Zones
The grape growing areas of the Niagara Peninsula were divided into different climatic zones which closely resemble the “Niagara Grape Climatic Zones”, map originally published in 1976 and revised in 2001 by Fisher and Slingerland.
20
Bud Sampling Locations
- 28 vineyard locations
28 vineyard locations -
- 18 vineyards W of canal & 10 vineyards E of
18 vineyards W of canal & 10 vineyards E of canal canal
- 14 cultivars sampled
14 cultivars sampled -
- 117 total samples
117 total samples
- Sample Dates (8)
Sample Dates (8) – – Nov 20/06, Dec 18/06, Jan 15/07, Jan 26/07, Nov 20/06, Dec 18/06, Jan 15/07, Jan 26/07, Feb 12/07, Feb 26/07, Mar 12/07, Apr 16/07 Feb 12/07, Feb 26/07, Mar 12/07, Apr 16/07
21
Live vs. Dead Grape Buds
1o 2o 3o
1o, 2o and 3o Buds Alive 1o Bud Dead
2o and 3o Buds Alive
1o, 2o and 3o Buds Dead
22
% Live Buds (Merlot) Jan 29-31, 2007
NS 92 Vinemount 85-91 NS Parkway 96 93 Lakeshore 96 93-96 Central 90-94 84-94 Bench East of Canal West of Canal
23
Assessing Vine Cold Hardiness
- Predicting at which cold
temperatures grape buds, xylem
- r phloem will die would be a
great tool for growers to know when, or if, to turn on wind machines
- However, the temperatures at
which bud mortality occurs changes depending on the variety, time of season & many other factors
24
Assessing Hardiness
- Use of precise,
programmable freezers that lower air temps slowly over time
- When ice crystals form
inside inside buds, xylem or phloem, a tiny amount of heat (exotherm) is released that can be measured with sensitive equipment
- ‘Spikes’ on graph tell
when killing temps occur
25
What is an exotherm?
- Definition – The amount of heat given off
by a chemical reaction
- As water freezes (ice nucleation) heat is
released from the system (exotherm)
H2O Liquid H2O Solid
HEAT
26
Source – Lynn Mills WSU 2006
27
Estimating Cold Hardiness of Grapevines in Niagara
28
Freezer #1
Modeled from California system (Wample)
Chiller Unit Sample Chamber Sample Chamber Thermistor Custom Software (BudFreeze)
29
Sample Chamber
- Cooled liquid travels from chiller, through
insulated tubing, into the top of the sample chamber and back to chiller
30
Sample Preperation
31
32
Sample Capacity
Old Setup – 10 wells x 5 buds/well
- 4 cultivars/day
New Setup – 8 wells x 5 buds/well
- 3 cultivars/day
# of daily samples
Baco Noir, Foch, Vidal
Hybrid cultivars being sampled (3)
Concord, Niagara
Labrusca cultivars being sampled (2)
Chardonnay, Riesling, Sauvignon Blanc, Pinot Gris, Pinot Noir, Gamay, Gewurztraminer, Cabernet Sauvignon, Cabernet Franc, Merlot
Vinifera cultivars being sampled (10)
All listed cultivars are currently being sampled one time each week.
33
Problems…
0.0002 0.0004 0.0006 0.0008 0.001 0.0012 0.0014 0.0016
- 40
- 30
- 20
- 10
10 0.0002 0.0004 0.0006 0.0008 0.001 0.0012 0.0014 0.0016
- 40
- 30
- 20
- 10
10
Data is still inconsistent
- - WORK IN PROGRESS --
0.0002 0.0004 0.0006 0.0008 0.001 0.0012
- 40
- 30
- 20
- 10
10
34
Tenney Freezer
Modeled from WSU system Modeled from WSU system
35
Thermistors and Trays
36
Data Acquisition System (DAS)
- 40 channel, high speed data scanning and
logging system
- Scans and logs all data from freezer unit
and organizes it into Excel
- ‘THE BRAIN’
37
In the near future
W.S.U. Freezer, March 2006 W.S.U. Freezer, March 2006
38
Summary
- Wind machines can modify vineyard temps
- Wind machines do not make vines hardier
- Be aware of wind machine sound & neighbours
- Monitor temperatures at your own vineyard
- Check bud viability throughout winter at your farm
39