2 MAINTAIN YOUR NABERS ENERGY RATING Ethan Burns Sustainability - - PowerPoint PPT Presentation

2
SMART_READER_LITE
LIVE PREVIEW

2 MAINTAIN YOUR NABERS ENERGY RATING Ethan Burns Sustainability - - PowerPoint PPT Presentation

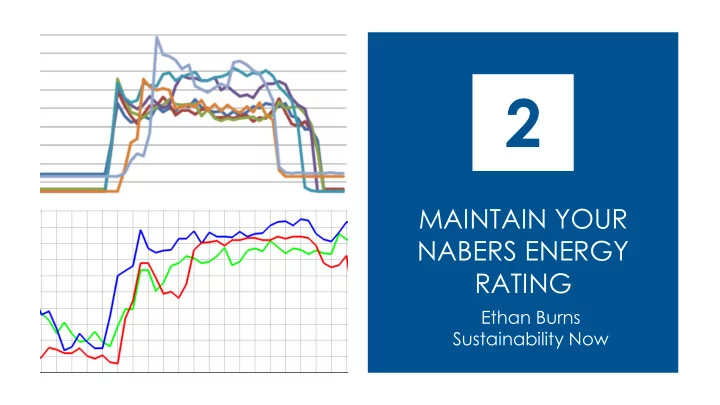
2 MAINTAIN YOUR NABERS ENERGY RATING Ethan Burns Sustainability Now THE ENERGY JOURNEY EN ENERGY FUNDAMENTALS MANAGE DEM DEMAND & & POW POWER FACTOR TOPICS MAINTAIN YOUR NABERS ENERGY RATING 1 Recap The benefits of


slide-1
SLIDE 1

2

MAINTAIN YOUR NABERS ENERGY RATING

Ethan Burns Sustainability Now

slide-2
SLIDE 2

THE ENERGY JOURNEY

EN ENERGY FUNDAMENTALS MANAGE DEM DEMAND & & POW POWER FACTOR

slide-3
SLIDE 3

TOPICS – MAINTAIN YOUR NABERS ENERGY RATING

1

Recap

2

The benefits of regular monitoring

3

Monitoring tools

4

Operational changes

5

Practical implementation

slide-4
SLIDE 4

DAILY LOAD PROFILE - CONSUMPTION, DEMAND, MAXIMUM DEMAND

Recap

slide-5
SLIDE 5

AUSGRID DEMAND / CAPACITY CHARGES

Recap

  • use >= 40 MWh pa
  • based on highest reading over a standard half-hour interval during the previous 12 months between 2pm and 8pm
  • n working weekdays
  • unit of measurement – kW or kVA – depends on annual consumption
  • 1 July 2018 to 30 June 2019 rates below

* including GST

Annual Consumption Tariff Cost * 40-160 MWh per annum EA302 LV 40-160 MWh 40.1023 c/kW/day 160-750 MWh per annum EA305 LV 160-750 MWh 40.1023 c/kVA/day > 750 MWh per annum EA310 LV >750 MWh 40.1023 c/kVA/day

slide-6
SLIDE 6

INTERVAL DATA

Recap

  • power demand at

various times throughout the day

  • 15 or 30 minute

intervals

  • interval / smart meters
slide-7
SLIDE 7
  • measure of how effectively you turn the

electricity supplied by your electricity distributor into actual productive power (i.e. light, heat, motive power)

  • mandatory to maintain a power factor of at

least 0.9

POWER FACTOR

Recap

slide-8
SLIDE 8

THE BENEFITS OF REGULAR MONITORING

Maintain Your NABERS Energy Rating

slide-9
SLIDE 9

Daily consumption Usage patterns – weekdays & weekends Time-of-use splits Maximum demand Power factor Know when things go wrong Recognise

  • pportunities for

reducing costs

KNOW YOUR BUILDING’S PATTERNS

The Benefits of Regular Monitoring?

slide-10
SLIDE 10

KNOW YOUR BUILDING – DAILY PATTERNS

The Benefits of Regular Monitoring?

slide-11
SLIDE 11

KNOW YOUR BUILDING – SEASONAL PATTERNS

The Benefits of Regular Monitoring?

slide-12
SLIDE 12

HIGHLIGHT YOUR ACHIEVEMENTS

The Benefits of Regular Monitoring?

49% reduction

slide-13
SLIDE 13

HIGHLIGHT YOUR ACHIEVEMENTS

The Benefits of Regular Monitoring?

slide-14
SLIDE 14

PROTECT YOUR NABERS RATING

The Benefits of Regular Monitoring?

slide-15
SLIDE 15

PEAK CAPACITY CHARGE BASED ON

  • highest reading
  • ver a standard half-hour interval
  • during the previous 12 months
  • between 2pm and 8pm on working

weekdays

LIMIT PEAK CAPACITY / DEMAND CHARGES

The Benefits of Regular Monitoring?

slide-16
SLIDE 16

LIMIT PEAK CAPACITY / DEMAND CHARGES

The Benefits of Regular Monitoring?

Poorly timed HVAC testing cost the site an extra $5,200 p.a. in demand charges

slide-17
SLIDE 17

LIMIT PEAK CAPACITY / DEMAND CHARGES

The Benefits of Regular Monitoring?

slide-18
SLIDE 18

OPPORTUNITY TO SHIFT LOADS (COST SAVINGS)

The Benefits of Regular Monitoring?

slide-19
SLIDE 19

ANTICIPATE EQUIPMENT FAILURES

The Benefits of Regular Monitoring?

Power factor fluctuations caused by a sick motor

slide-20
SLIDE 20

SERVICE CONTRACTOR ACCOUNTABILITY

The Benefits of Regular Monitoring?

  • not uncommon for contractors to create a

new problem

  • examples in next section
slide-21
SLIDE 21

PHANTOM ENERGY USERS

The Benefits of Regular Monitoring?

Hidden timer for car park exhaust fans

slide-22
SLIDE 22

ILLEGAL USE OF COMMON PROPERTY

The Benefits of Regular Monitoring?

Image source: Wattblock

slide-23
SLIDE 23

WHAT CAN GO WRONG?

The Benefits of Regular Monitoring?

slide-24
SLIDE 24
  • car park ventilation

controlled by CO monitors

  • technician testing fire

equipment left fan control switch on “manual”

  • fans ran 24/7 for 2 weeks

until a resident noticed

  • $100 extra per day

SERVICE CONTRACTORS CREATE NEW PROBLEMS

The Benefits of Regular Monitoring?

slide-25
SLIDE 25
  • sump pumps left running

continuously after quarterly service

  • unlikely to be noticed

between quarterly services due to location

  • would have cost approx

$2K between services

SERVICE CONTRACTORS CREATE NEW PROBLEMS

The Benefits of Regular Monitoring?

slide-26
SLIDE 26

SERVICE CONTRACTORS CREATE NEW PROBLEMS

The Benefits of Regular Monitoring?

Power factor correction unit left switched off after service

slide-27
SLIDE 27

SERVICE CONTRACTORS CREATE NEW PROBLEMS

The Benefits of Regular Monitoring?

Never found out & it went back to “normal” after 2 weeks!

slide-28
SLIDE 28

EQUIPMENT FAILURE – CO SENSOR

The Benefits of Regular Monitoring?

Additional 24-hour load

  • f ~ 4kW for

a year

slide-29
SLIDE 29

EQUIPMENT FAILURE

The Benefits of Regular Monitoring?

VSDs on bathroom exhaust fans

slide-30
SLIDE 30
  • new load

between 11:00 pm and 6:30 am (outside working hours)

  • timer on stand-

alone air- conditioner in building manager’s office

  • would no have

been picked up

  • therwise!

EQUIPMENT FAILURE

The Benefits of Regular Monitoring?

slide-31
SLIDE 31

EQUIPMENT FAILURE

The Benefits of Regular Monitoring?

Solar system

  • utage
slide-32
SLIDE 32

MONITORING TOOLS

Maintain Your NABERS Energy Rating

slide-33
SLIDE 33
  • limited information other

than something’s wrong!

  • can’t identify when

problem occurred

  • worse if quarterly

INVOICE COMPARISONS

Monitoring Tools

slide-34
SLIDE 34
  • reveals if equipment is operating out of normal hours
  • allows you to investigate irregularities
  • allows you to check maximum demand / peak capacity
  • free access to RAW interval data for past 2 years through Ausgrid or retailer
  • www.ausgrid.com.au/Your-energy-use/Meters/Access-your-meter-data

INTERVAL DATA

Monitoring Tools

slide-35
SLIDE 35

SUBSCRIPTION REPORTS

Monitoring Tools

slide-36
SLIDE 36
  • somewhat limited information
  • frequency
  • could narrow down to day of problem
  • cannot generate different report

combinations

  • difficult to combine months / historical

data

ENERGY ACTION

Monitoring Tools

slide-37
SLIDE 37

ENERGY ACTION

Monitoring Tools

slide-38
SLIDE 38

ENERGY ACTION

Monitoring Tools

slide-39
SLIDE 39

ARE YOU ALREADY SUBSCRIBED?!

Monitoring Tools

Your experience?

slide-40
SLIDE 40

FREE WEB PORTALS FROM RETAILERS

Monitoring Tools

slide-41
SLIDE 41

RETAILERS’ FREE WEB PORTALS

Monitoring Tools

Data generally includes

  • consumption
  • interval data
  • maximum

demand

  • power factor
  • time-of-use
  • invoices

(easier for NABERS!)

  • user manual

Other factors

  • current to

last 24 hours, generally

  • available

data varies by retailer

Advantages

  • free

Disadvantages

  • lose history

when change retailer

Who already uses one? Comments?

slide-42
SLIDE 42

ENERGY AUSTRALIA - KINETIQ

Monitoring Tools

  • for large users on contracts with a 6-

digit account number

  • complete application form, scan

and email to the address on form

  • if information correct, receive login

details within 2-3 working days

  • manual available for download
  • small-medium users with a 10-digit

account number can setup access to My Account through the Energy Australia website

slide-43
SLIDE 43

AGL – BUSINESS IQ

Monitoring Tools

  • available to large market accounts
  • generally the account number

starts with a 1

  • ption to register for access at the

bottom of https://www.agl.com.au/business/la rge-business/business-iq

  • nce registration is complete you

should have immediate access to the portal.

slide-44
SLIDE 44

ORIGIN - ENERGYLINK

Monitoring Tools

  • for large business customers
  • send an email with your name, email

address, phone number and account number to energylink@originenergy.com.au to request access to the portal

  • YouTube guide

https://www.youtube.com/watch?v=wRB5Qt 2f1JY

  • My Account option for small – medium users;

Register at https://www.originenergy.com.au/business/ my-account.html

slide-45
SLIDE 45

MOMENTUM - CLARITI

Monitoring Tools

  • register for portal access at

https://auth.momentumenergy.com.au/PortalLoginRegister?startURL=%2Fidp%2Flogin%3Fapp%3D0sp28000000CcO3%26RelayState%3D%252Fmyacco unt%252Fdashboard%26binding%3DHttpPost%26inresponseto%3D_aa104a67-dc81-4124-a041-9dd3f56925b6

  • select “Business Customer” under “Register Now, and then select “Register” to complete the registration process.
  • have a copy of an invoice handy and the owners corporation’s ABN
  • call 1300 662 778 if any problems with registering
  • nce you’re logged in, you should see a link to “My Usage”
slide-46
SLIDE 46

ERM

Monitoring Tools

slide-47
SLIDE 47
  • Call or email ERM and they’ll setup access to its online portal
  • Call 13 23 76 – setup in 10 minutes
  • Email with your contact and account details to service@ermpower.com.au, with 24-hour turnaround

ERM

Monitoring Tools

slide-48
SLIDE 48

OC ENERGY

  • when last contacted, had a portal under development

but wasn’t prepared to give estimated availability dates

  • acquired by Origin Energy 1 March 2019

RED ENERGY

  • no current offering
  • had trial earlier last year
  • no other info available

OTHERS

Monitoring Tools

slide-49
SLIDE 49

SUBSCRIPTION PRODUCTS

Monitoring Tools

slide-50
SLIDE 50

Options depend on your Meter Provider (MP) and your Metering Data Provider (MDP).

  • they were assigned to your account after construction and don’t change unless you change your

meter

  • all covered by the National Electricity Rules

How do I find out who my Metering Data Provider is?

  • no publicly available register
  • your retailer has access to the relevant database and is able to tell you

Most of the basic subscription packages (which give you a lot of information) are priced from $200 p.a.

METERING DATA PROVIDERS

Monitoring Tools

slide-51
SLIDE 51

MDP PRODUCTS

Monitoring Tools

MDP Product URL Plus ES (formerly Ausgrid) WebGraphs webgraphs.com.au Metering Dynamics InfoDynamics infodynamics.com.au Mondo UtiliView mondo.com.au/log-in

slide-52
SLIDE 52
  • products take a direct feed from a range of MDPs every 24 hours.
  • have the same range of functionality as products from the MDPs.
  • price will vary depending on how much the MDP charges for its data.
  • subscription packages range from $200 - $500 p.a.

METER-INDEPENDENT SUBSCRIPTION PRODUCTS

Monitoring Tools

SUMS - Smart Utility Management Solution

slide-53
SLIDE 53

OPERATIONAL CHANGES

Maintain Your NABERS Energy Rating

slide-54
SLIDE 54
  • Do not test between 2pm & 8pm working week days
  • car park exhaust systems
  • ther HVAC services
  • fire services
  • any system that will detrimentally impact demand
  • Beware of 2pm & 8pm working week days generally!

TIME OF DAY FOR MAJOR SERVICES

Operational Changes

slide-55
SLIDE 55

IMPORTANCE OF MAINTENANCE

Operational Changes

  • Poorly / not maintained equipment

uses more energy

  • dirt
  • heating & cooling systems
  • hot water systems
  • air leaks
  • poor calibration
  • etc
  • Maintenance extends equipment life
slide-56
SLIDE 56
  • Develop site specific

energy efficiency maintenance specifications

  • Supervise & monitor

performance of maintenance contractors

  • Penalties / incentives in

contracts – carrot or stick?

MAINTENANCE DELIVERY FOR ENERGY EFFICIENCY OUTCOMES

Operational Changes

slide-57
SLIDE 57

ASSET REGISTER INTEGRATION

Operational Changes